Settlement and Load Distribution Analysis of Pile Groups
Summary.-Analyses are made of the settlement interaction between two compressible floating piles in a semi-infinite mass, and between two compressible piles resting on a rigid bearing stratum. The results of these analyses are expressed in terms of interaction factors relating the increase in settlement due to the second pile to the settlement of a single pile. It is shown that, as previously found with incompressible floating pile groups, the interaction factors for two piles may be superposed to analyse the settlement and load distribution within any compressible pile group.
The influence on group behaviour of the compressibility of the piles relative to the soil is examined for square groups of piles. It is found that, for a floating pile group, the settlement interaction decreases as the piles become relatively less compressible, and for a group with a rigid pile cap, the load distribution within the group becomes more uniform. In contrast, for a group of end-bearing piles, the settlement interaction increases as the piles become relatively less compressible while the load distribution within a group having a rigid cap becomes less uniform.
Comparisons between theoretical group behaviour and that observed from model and field tests generally show good agreement.
List of symbols
| Cross-sectional area of pile. | |
| Pile displacement influence factor (end-bearing pile). | |
| Matrix of factors of type . | |
| Young’s modulus of pile. | |
| Modulus of elasticity of soil. | |
| Modulus of elasticity of soil skeleton. | |
| Displacement influence factor for soil displacement at element due to uniform stress on element on pile . | |
| Unit matrix or order by . | |
| Pile displacement factor. | |
| Matrix of soil displacement influence factors of type . | |
| Pile stiffness factor . | |
| Length of pile. | |
| Load on pile. | |
| Average pile load in group. | |
| Total load on pile group. | |
| Load on pile in group. | |
| Area ratio of pile . | |
| Group reduction factor. | |
| Settlement ratio. | |
| Maximum differential settlement between centre and corner piles of a group with equally-loaded piles. | |
| Maximum settlement within a group with equally loaded piles. | |
| Settlement of a group of piles with a rigid pile cap. | |
| Total final settlement. | |
| Immediate settlement. | |
| Matrix of constants. | |
| Diameter of pile. | |
| Constant . | |
| Distance between centre of element and base of pile. | |
| Vector of values of . | |
| Integers. | |
| Number of piles in group. | |
| Number of pile elements. | |
| Uniform normal stress on base of pile. | |
| Uniform shear stress around periphery of pile element . | |
| Vector of stresses and . | |
| Centre-to-centre spacing of adjacent piles in group. | |
| Pile interaction factor. | |
| Pile interaction factor between piles and . | |
| Length of pile element . | |
| Group displacement. | |
| Displacement of a single pile under unit load. | |
| Vector of pile displacements. | |
| Vector of soil displacements. | |
| Poisson’s ratio of soil. | |
| Poisson’s ratio of soil skeleton. |
1.—INTRODUCTION
Theoretical analyses of the behaviour of pile groups have recently been reported by Pichumani and D’Appolonia (Ref. 8) and Poulos (Ref. 9). In the former paper, solutions have been presented for the distribution of load. and the displacement of square pile groups, both floating and end-bearing, in a soil which exhibits perfectly elastic-plastic behaviour. In the latter paper, the behaviour of groups of incompressible floating piles at working loads has been analysed and it has been shown that the principle of superposition may be applied to analyse the settlement and load distribution in any general pile group. Solutions have been presented for square pile groups for a wide range of cases, and the effects of group size, pile spacing and length-to-diameter ratio on the behaviour of the groups have been considered. In both papers, use is made of elastic theory, and comparisons between theoretical and observed group behaviour show reasonable agreement.
Neither of the above papers however examines the influence of the pile compressibility on group behaviour, although the method of analysis of Pichumani and D’Appolonia (Ref. 8) is capable of taking this into account. In this paper, a method for analysing the behaviour of groups of compressible piles, both floating and end-bearing, is presented. The method of analysis presented here for general pile groups has some advantage over the general computer method presented by Pichumani and D’Appolonia in that it is amenable to hand calculation. Also, in the present analysis, the shear stresses acting on the pile surface are approximated by a series of uniformly distributed loads acting around the surface of the pile whereas the analysis of Pichumani and D’Appolonia assumes a series of point loads acting along the pile axis. The former approximation has been shown to be more accurate by Poulos and Davis (Ref. 10).
Theoretical solutions for the settlement and load distribution in compressible pile groups are presented, with emphasis placed on examining the influence on group behaviour of the relative compressibility of the piles. Comparisons are then made between theoretical and observed settlement characteristics to determine the applicability of the theoretical approach to real problems. The use of the theory in practical problems is subsequently discussed.
The work in this paper is an extension of the work described by Poulos (Ref. 9) for incompressible floating groups, Mattes and Poulos (Ref. 7) for a single compressible floating pile, and by Poulos and Mattes (Ref. 11) for a single end-bearing pile. Attention is confined to the case of floating piles in a semi-infinite elastic mass and end-bearing piles resting on a rigid bearing stratum. All groups are assumed to be free-standing, i.e., there is assumed to be no contact between the soil and the pile cap. No account is taken of the effects of yield within the soil, although the analysis could be modified to take this aspect of soil behaviour into account (see for example, Pichumani and D’Appolonia, Ref. 8). However, from the analysis of a single compressible pile by Mattes and Poulos (Ref. 7), it would appear likely that the effects of local yield within the soil at normal working loads are unlikely to be significant unless the piles are very compressible.
2.—ANALYSIS OF A GROUP OF TWO PILES
2.1 Floating Piles:
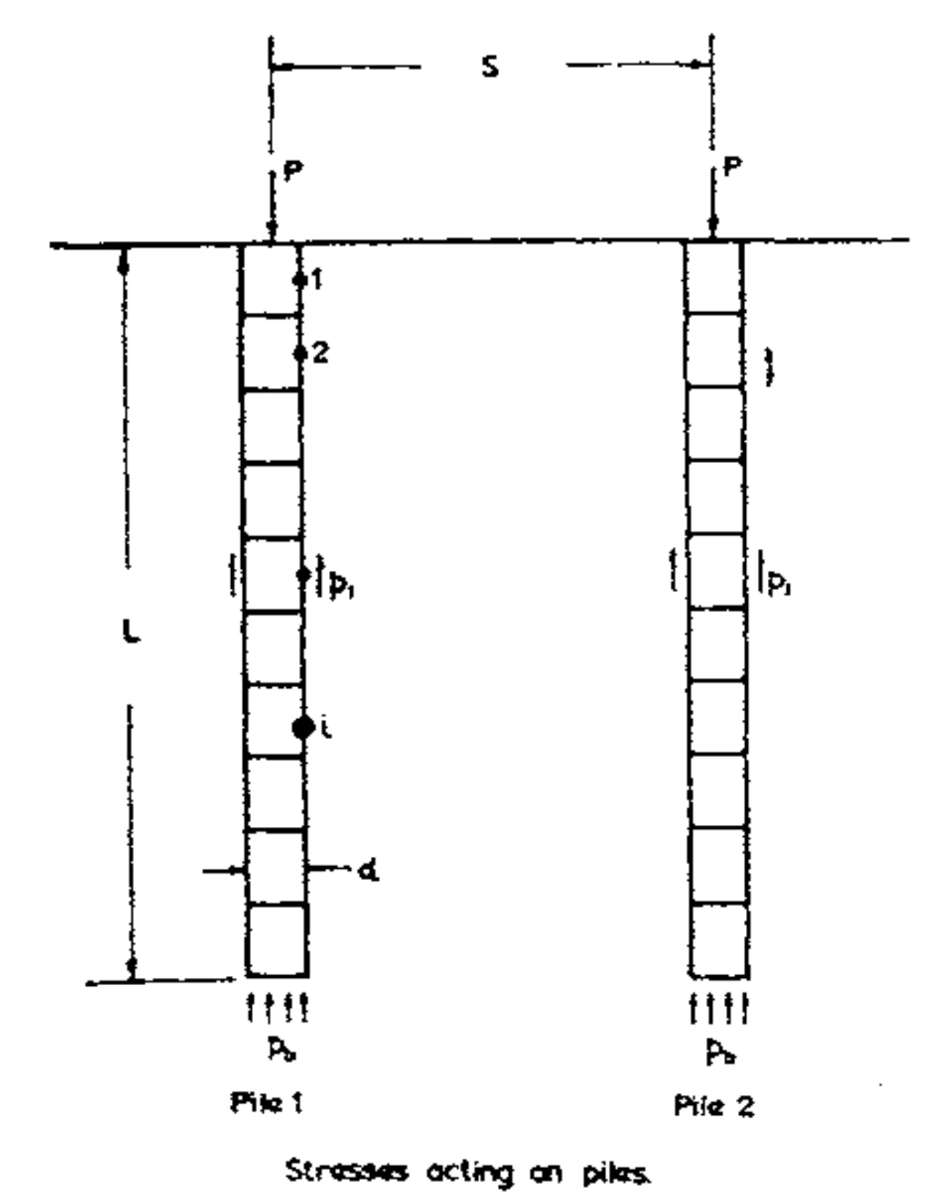
Two equally-loaded, identical, cylindrical piles in an ideal semi-infinite mass having constant elastic parameters Es and Vs are considered, as shown in Fig. 1. The piles are of length , diameter and cross-sectional area , and are spaced at a centre-to-centre distance . The elastic modulus of the pile material is , and each pile is divided into equal cylindrical elements, any element being loaded by a uniform vertical shear stress acting around the periphery of the element, and a circular base acted upon by a uniform vertical stress . Since elastic conditions are assumed at the pile-soil interface, the displacements of the pile and the soil at each element are equated in order to solve for the n unknown stresses , the base stress , and the corresponding displacement distribution along the pile.
It has been shown by Poulos (Ref. 9) that the soil displacements at the element centres along the pile may be written as
where is the by matrix of soil displacement influence factors, any element representing the displacement influence at point of stress on element of pile 1 and pile 2, and and are stress and soil displacement vectors. All elements of are obtained by double integration of the Mindlin equation as described by Poulos and Davis (Ref. 10).
Because the condition of no slip between pile and soil has been imposed, Eq. (1) can be combined with the equation obtained by Mattes and Poulos (Ref. 7) relating pile deformations to the stresses acting over the surface of the pile to give the equation
where is the unit matrix of order by ,
, the pile stiffness factor, which is a measure of the compressibility of the pile relative to the soil (the smaller the value of , the more compressible is the pile),
ratio area (for solid piles, ),
is an by matrix of coefficients of pile action,
is an column vector.
Eq. (2) can be solved with the equilibrium equation,
to obtain the unknown stresses acting on the pile, whence the displacement distribution may be determined from Eq. (1). The range of values of the pile stiffness factor likely to occur in practical problems is discussed in Section 7 of this paper.
2.2 End-Bearing Piles:
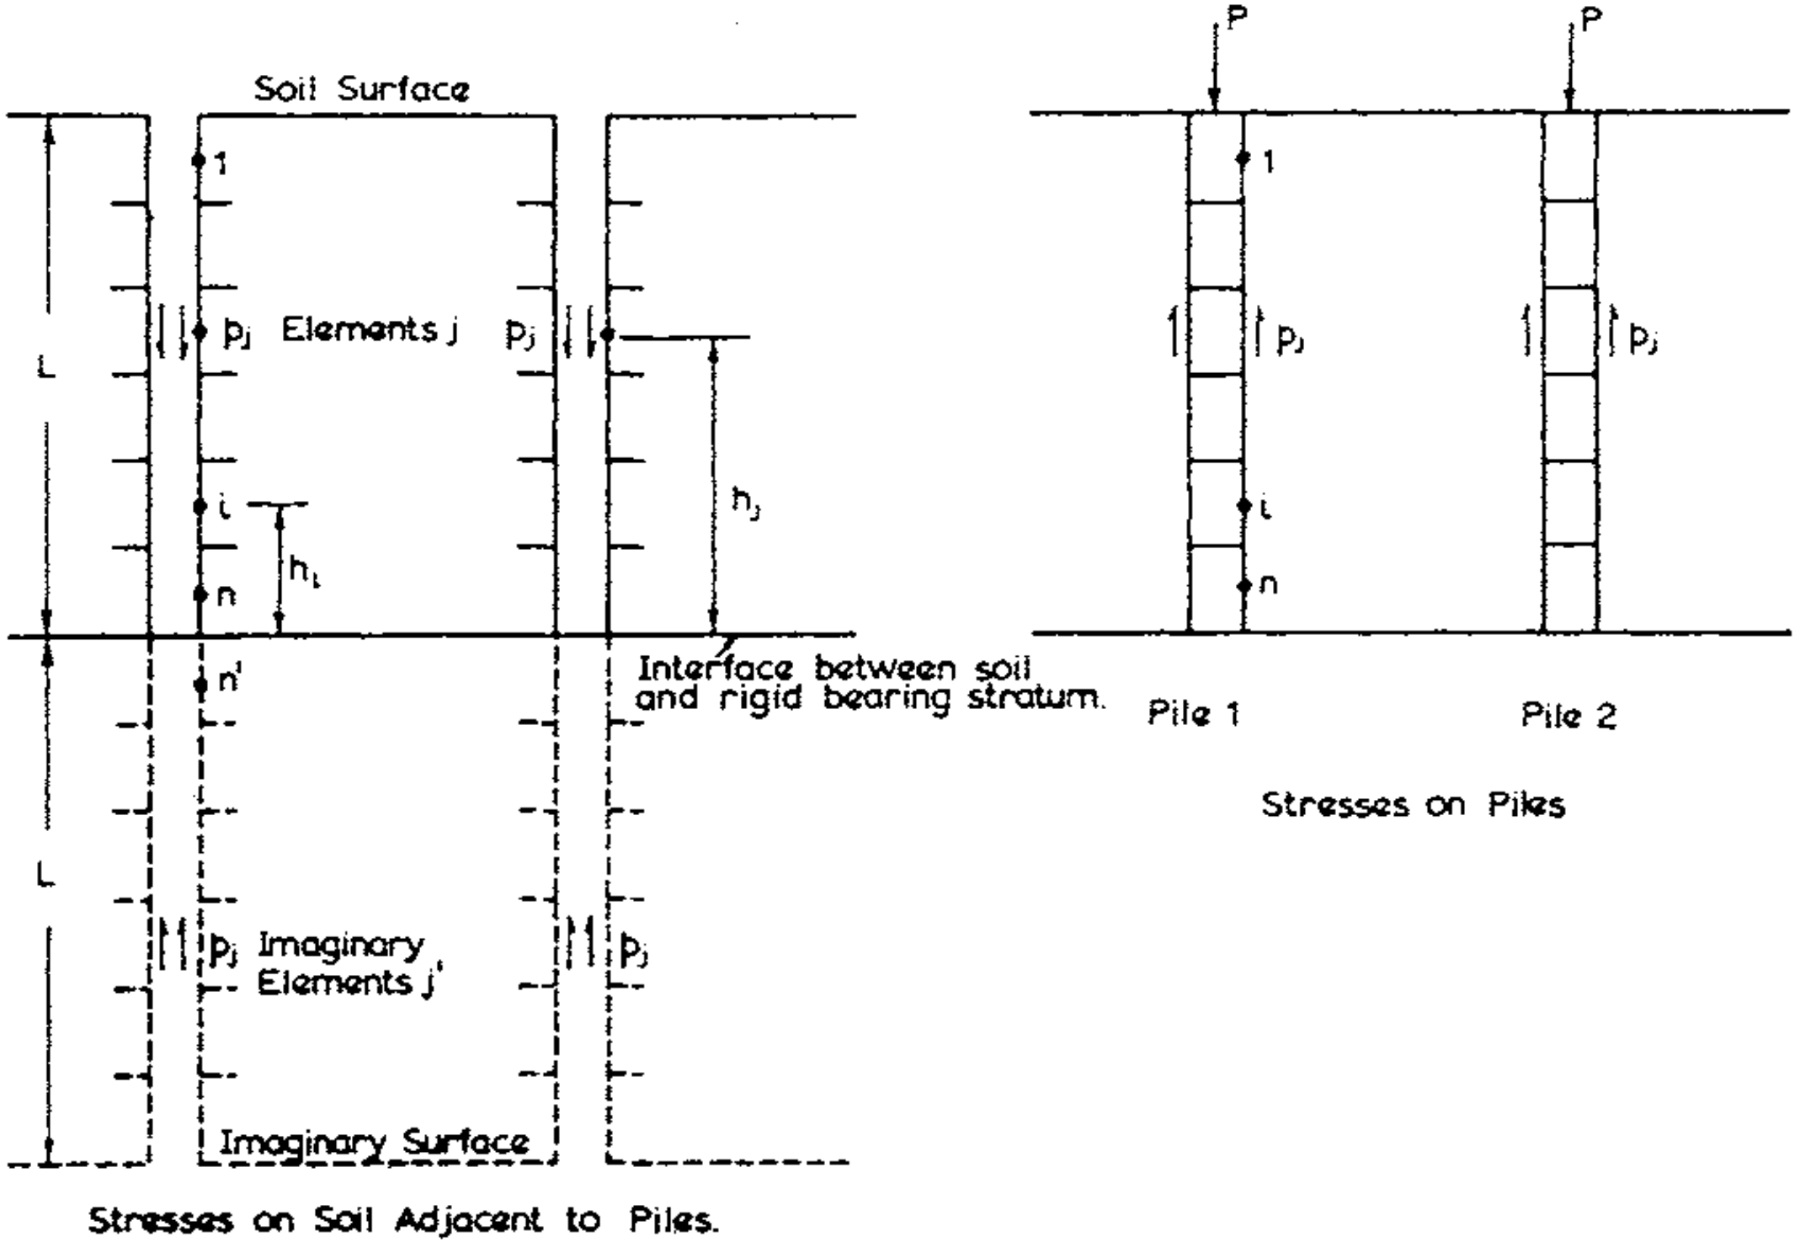
As shown in Fig. 2, two equally-loaded identical cylindrical piles of diameter , length , cross-sectional area and material elastic modulus , resting on a perfectly rigid base, are considered. Each pile is divided into equal cylindrical elements while the soil layer is again assumed to be an ideal elastic material with constant elastic parameters and .
The soil displacement at each element may be calculated as for the floating piles, except that an allowance must be made for the influence of the rigid base on the soil displacements. An approximate method whereby this may conveniently be done has been suggested by D’Appolonia and Romualdi (Ref. 2) in which a mirror-image element of element , loaded by an equal and opposite shear stress, is introduced. This method has been used by Poulos and Mattes (Ref. 11) in dealing with the behaviour of single end-bearing piles. Taking downwards displacements as positive, and referring to Fig. 2, the soil displacements along either pile may again be expressed by Eq. (1), .where is now the by matrix of soil displacement influence factors, any element being the influence factor for displacement at due to the uniform shear stress on elements of pile 1 and pile 2, and on elements of the imaginary mirror-image piles 1 and 2. The elements of are again obtained by double integration of the Mindlin equation.
Since no slip is allowed between piles and soil, the soil displacement equation may be combined with the pile action equation obtained by Poulos and Mattes (Ref. 11) to give the following equation:
where is the pile stiffness factor, defined in Section 2.1,
is an by matrix of coefficients related to the pile geometry,
is the vector of distances from the rigid base to the centre of pile elements.
Eq. (4) may be solved for the unknown stresses on each pile whereby the displacements can be calculated. The load transferred to the pile tip is calculated as the difference between the applied load and the sum of the shear forces acting along the pile surface.
3.-SOLUTIONS FOR TWO-PILE GROUPS
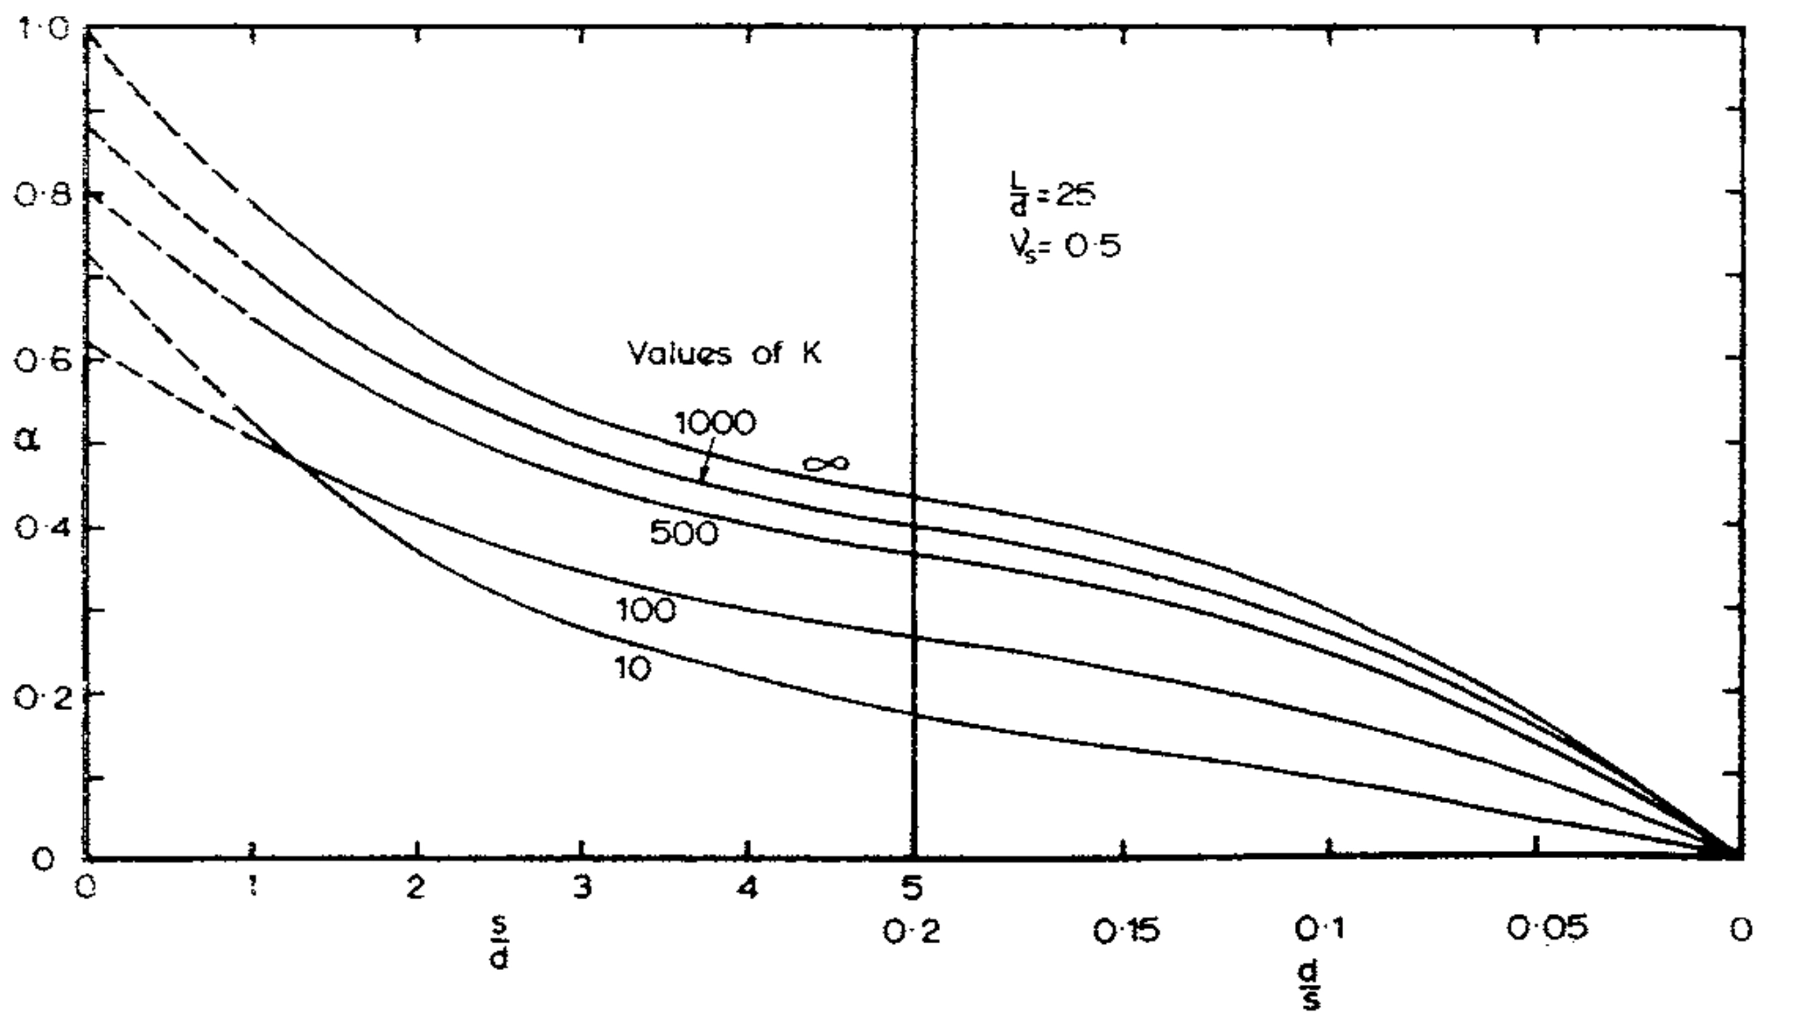
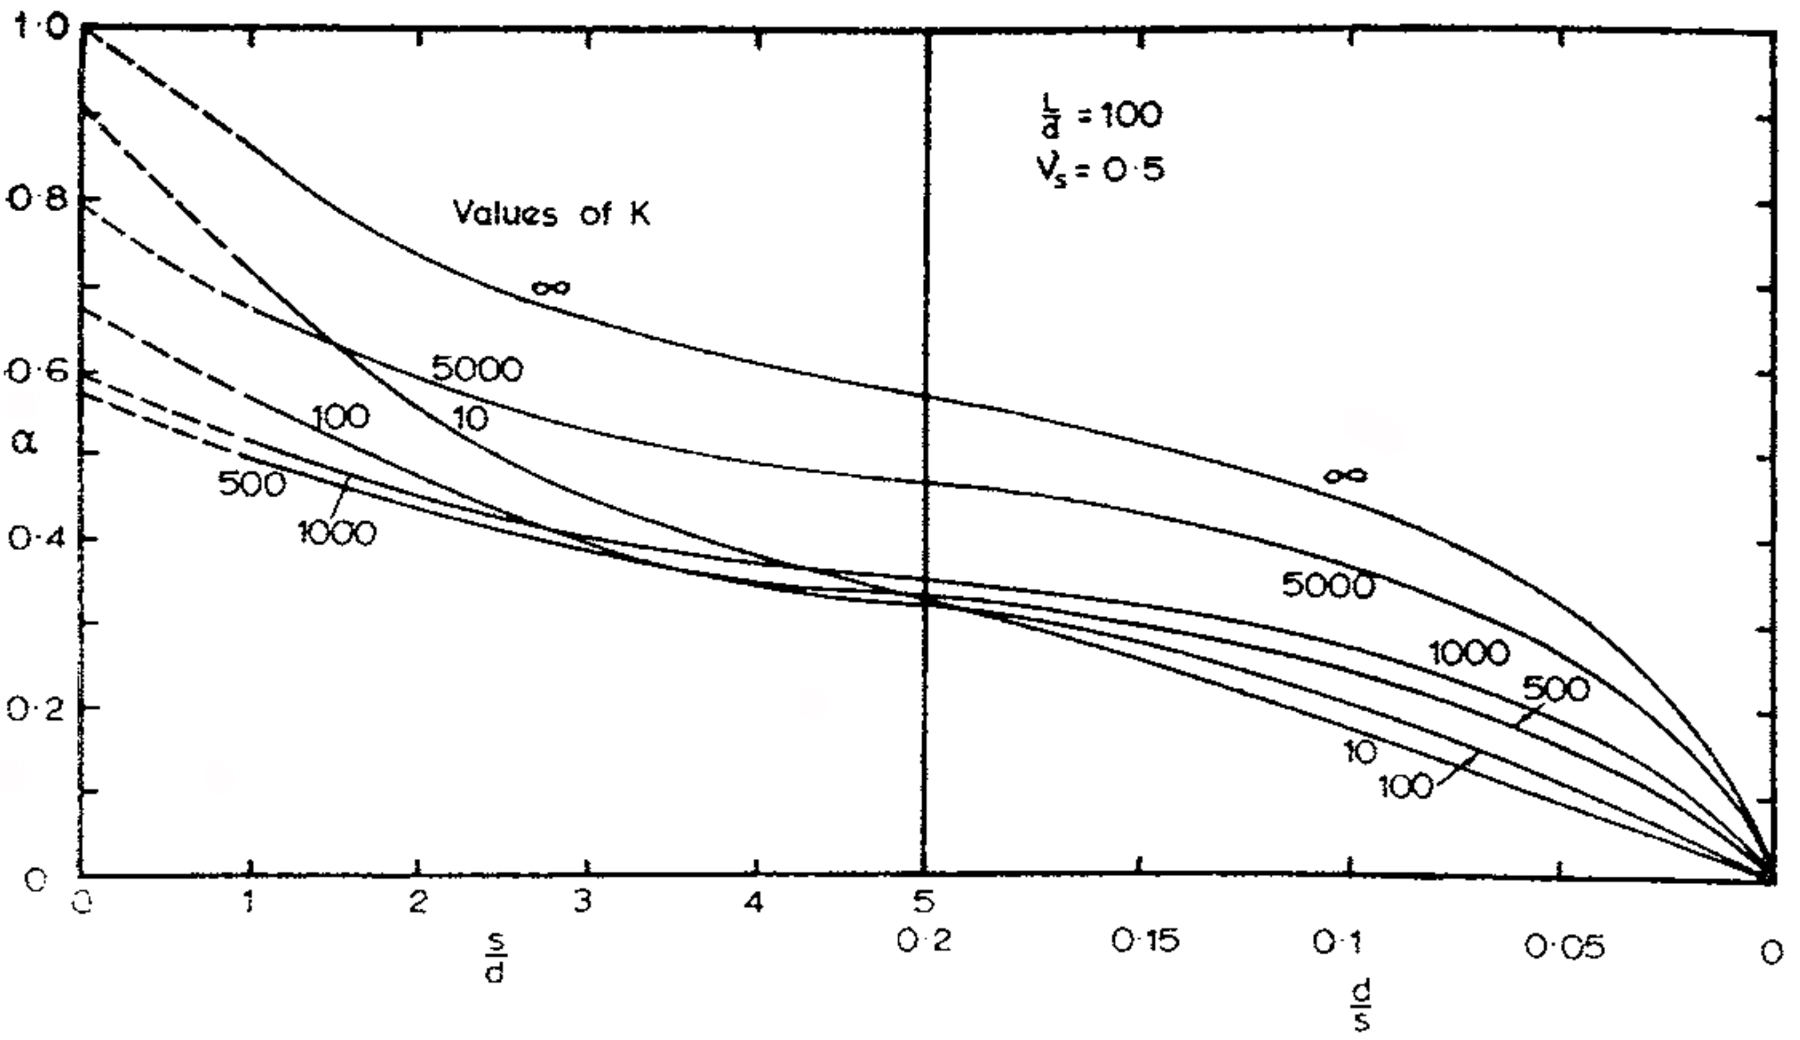
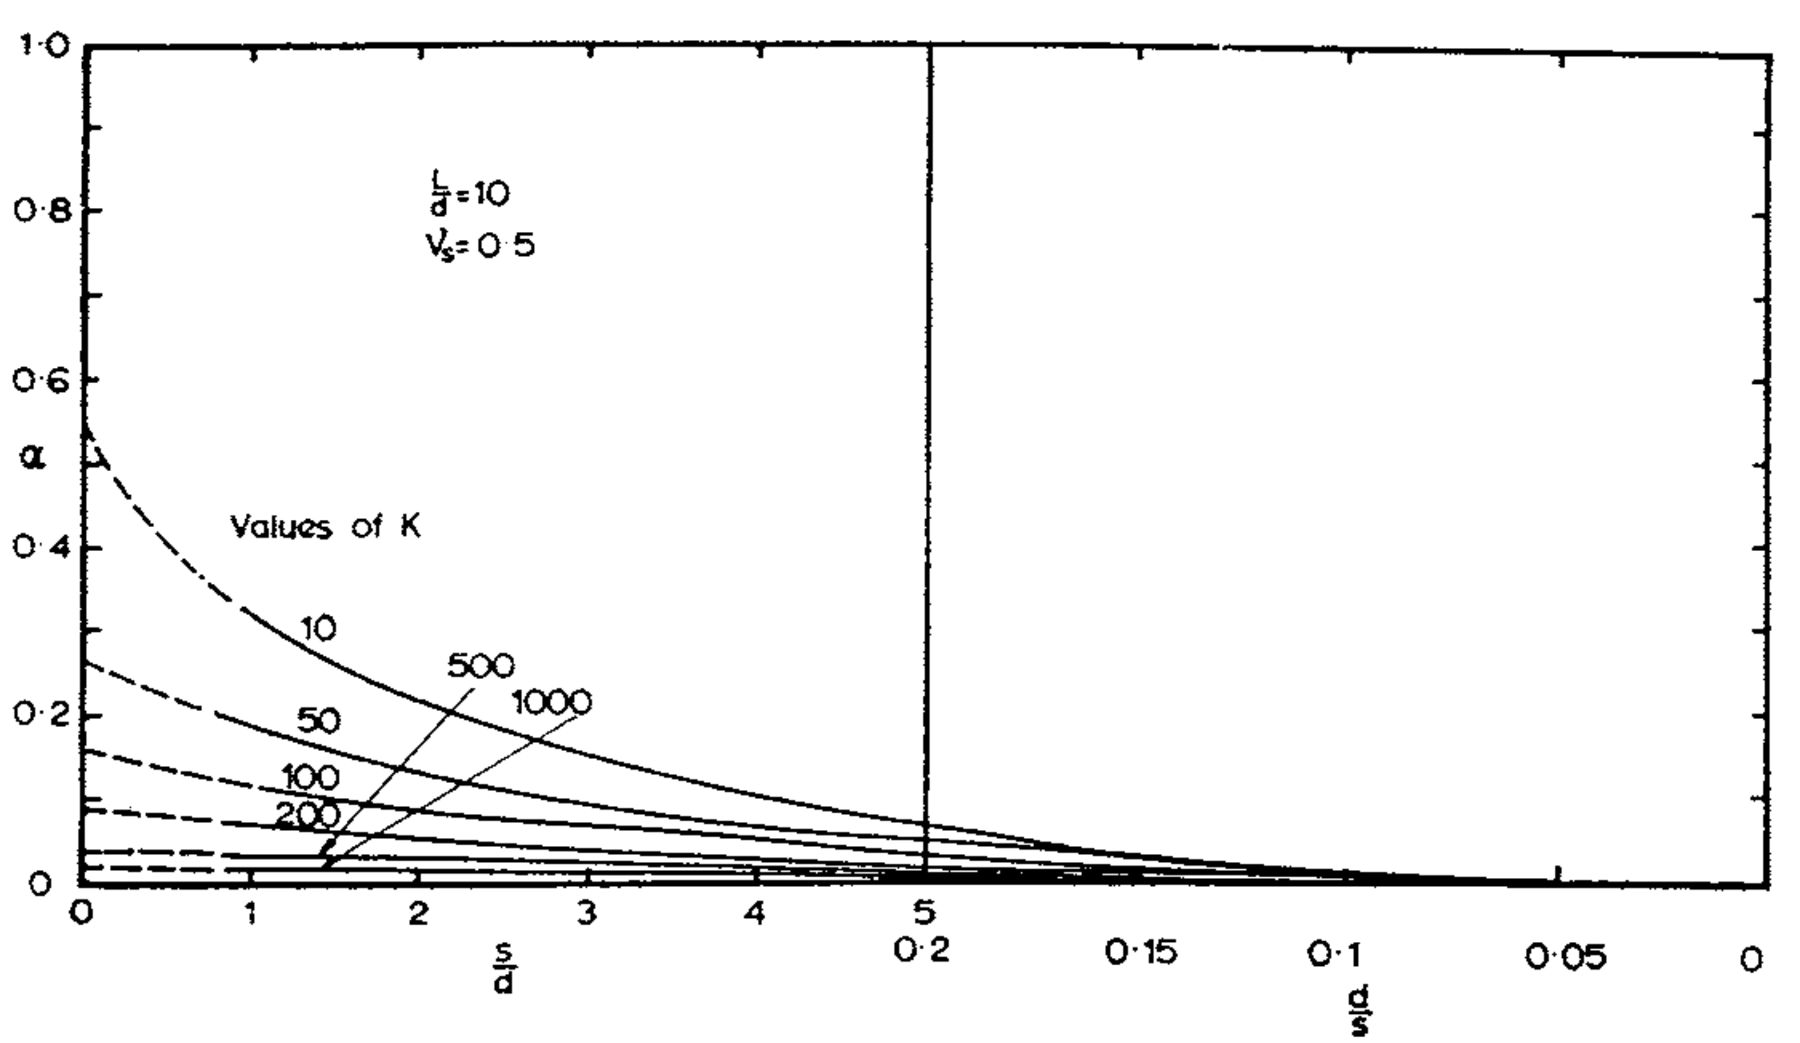
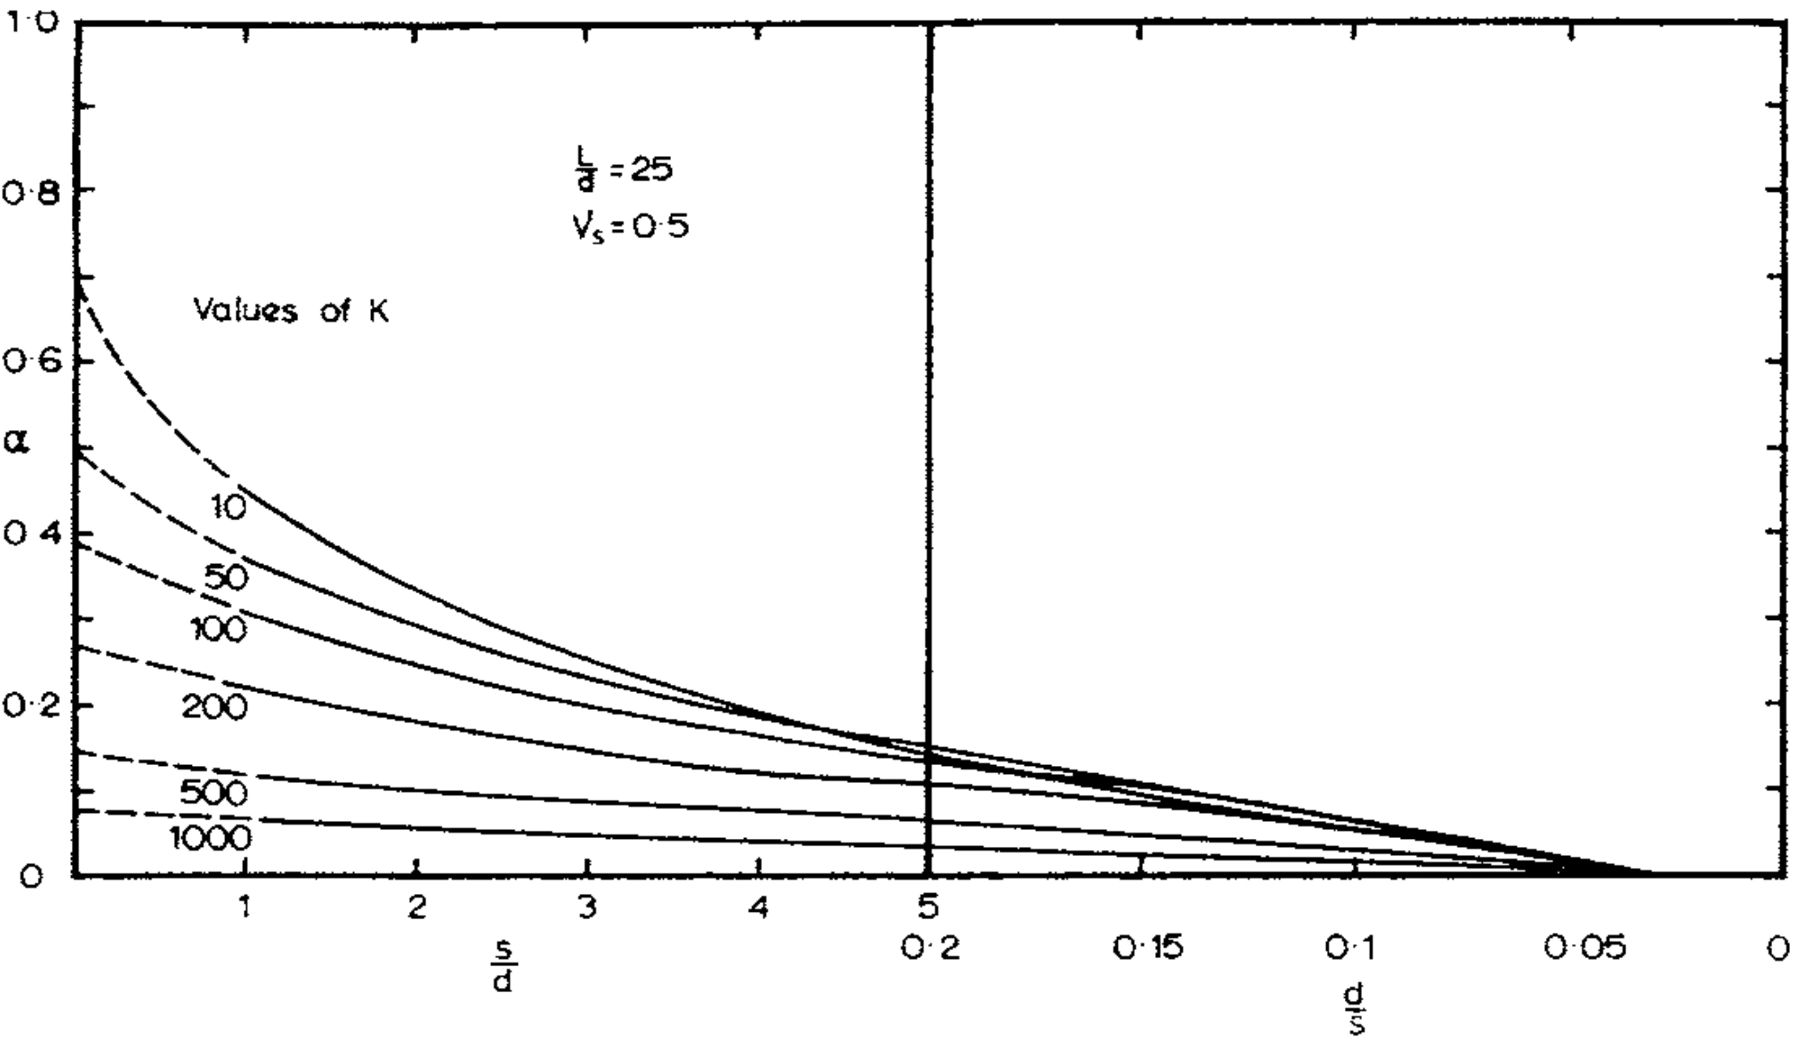
It is convenient to define the additional displacement at the top of a pile due to an equally loaded identical adjacent pile in terms of an interaction factor (Ref. 9) where
Also, from equilibrium, if the total load on the pile group is , then
Eqs. (7) and (8) may be solved for two limiting conditions:
- equal load in all piles,
- equal displacement of all piles, corresponding to a perfectly rigid pile cap.
The displacement of the group so calculated may be expressed either in terms of the settlement ratio Rs of the group, where Rs is the ratio of the settlement of the group to the settlement of a single pile carrying the same average load as a pile in the group, or the group reduction factor RG, where RG is the ratio of the group settlement to the settlement of a single pile carrying the same total load as the group. For a group of m piles, R is related to RG as follows:
It should be noted that for a group in which all piles carry equal load, different values of and may be appropriate for different piles in the group. In practical problems, is likely to be the more useful quantity, but in examining the theoretical behaviour of pile groups under elastic conditions has some advantage as it always lies within the range 1 to 1/. Consequently in the solutions described in the following section, displacements are expressed in terms of . It may be helpful to note that in fact represents the settlement of the group if the settlement of the corresponding single pile is unity—thus is a direct measure of the settlement of a group under a given load.
To illustrate the use of the method of superposition for calculating the settlement of a pile group, an example is given in Appendix C. Solutions obtained for square groups of piles are described below.
| Group Size | |||||||||||||||||
|---|---|---|---|---|---|---|---|---|---|---|---|---|---|---|---|---|---|
| 10 | 100 | 1000 | 10 | 100 | 1000 | 10 | 100 | 1000 | 10 | 100 | 1000 | ||||||
| 10 | 2 | 0.457 | 0.562 | 0.636 | 0.654 | 0.309 | 0.422 | 0.491 | 0.498 | 0.235 | 0.343 | 0.400 | 0.408 | 0.190 | 0.288 | 0.339 | 0.347 |
| 5 | 0.351 | 0.432 | 0.471 | 0.476 | 0.203 | 0.277 | 0.313 | 0.317 | 0.141 | 0.203 | 0.234 | 0.239 | 0.107 | 0.159 | 0.188 | 0.190 | |
| 10 | 0.302 | 0.347 | 0.370 | 0.374 | 0.158 | 0.196 | 0.219 | 0.221 | 0.102 | 0.134 | 0.154 | 0.154 | 0.074 | 0.101 | 0.118 | 0.118 | |
| 20 | 0.276 | 0.295 | 0.310 | 0.310 | 0.135 | 0.152 | 0.166 | 0.166 | 0.083 | 0.097 | 0.109 | 0.109 | 0.056 | 0.069 | 0.079 | 0.079 | |
| 0.250 | 0.250 | 0.250 | 0.250 | 0.111 | 0.111 | 0.111 | 0.111 | 0.062 | 0.062 | 0.062 | 0.062 | 0.040 | 0.040 | 0.040 | 0.040 | ||
| 25 | 2 | 0.497 | 0.534 | 0.662 | 0.718 | 0.334 | 0.404 | 0.538 | 0.588 | 0.264 | 0.336 | 0.456 | 0.506 | 0.216 | 0.290 | 0.411 | 0.450 |
| 5 | 0.367 | 0.436 | 0.532 | 0.547 | 0.220 | 0.290 | 0.387 | 0.415 | 0.154 | 0.221 | 0.310 | 0.334 | 0.118 | 0.179 | 0.260 | 0.281 | |
| 10 | 0.313 | 0.365 | 0.435 | 0.445 | 0.166 | 0.217 | 0.286 | 0.303 | 0.109 | 0.154 | 0.214 | 0.227 | 0.079 | 0.119 | 0.171 | 0.180 | |
| 20 | 0.278 | 0.313 | 0.358 | 0.366 | 0.137 | 0.167 | 0.209 | 0.214 | 0.084 | 0.110 | 0.147 | 0.148 | 0.059 | 0.080 | 0.112 | 0.112 | |
| 0.250 | 0.250 | 0.250 | 0.250 | 0.111 | 0.111 | 0.111 | 0.111 | 0.062 | 0.062 | 0.062 | 0.062 | 0.040 | 0.040 | 0.040 | 0.040 | ||
| 100 | 2 | 0.640 | 0.578 | 0.565 | 0.789 | 0.492 | 0.450 | 0.457 | 0.683 | 0.401 | 0.384 | 0.406 | 0.620 | 0.339 | 0.336 | 0.370 | 0.574 |
| 5 | 0.471 | 0.470 | 0.502 | 0.661 | 0.311 | 0.327 | 0.375 | 0.541 | 0.234 | 0.253 | 0.311 | 0.471 | 0.187 | 0.207 | 0.270 | 0.422 | |
| 10 | 0.368 | 0.391 | 0.441 | 0.569 | 0.217 | 0.241 | 0.303 | 0.437 | 0.153 | 0.175 | 0.238 | 0.364 | 0.118 | 0.139 | 0.200 | 0.315 | |
| 20 | 0.310 | 0.327 | 0.380 | 0.481 | 0.165 | 0.183 | 0.239 | 0.338 | 0.109 | 0.125 | 0.179 | 0.270 | 0.080 | 0.094 | 0.144 | 0.228 | |
| 0.250 | 0.250 | 0.250 | 0.250 | 0.111 | 0.111 | 0.111 | 0.111 | 0.062 | 0.062 | 0.062 | 0.062 | 0.040 | 0.040 | 0.040 | 0.040 | ||
Floating Pile Groups, Rigid Cap. Group Reduction Factor,
5.—TYPICAL SOLUTIONS FOR SQUARE PILE GROUPS
Solutions have been obtained for square groups of 4, 9, 16 and 25 piles, denoted subsequently as 2′, 3′, 4″ and 52 groups. Both floating and end-bearing piles have been considered and in each case the settlement distribution within a group in which all the piles are equally loaded, and the load distribution and settlement of a group with a rigid cap, have been investigated.
5.1 Floating Pile Groups:
Group reduction factors for typical floating pile groups with rigid caps are given in Table II. For all groups, decreases as the pile spacing increases, and in almost every case, decreases as pile stiffness decreases, the only exception being groups of slender, very compressible piles at very close spacings.
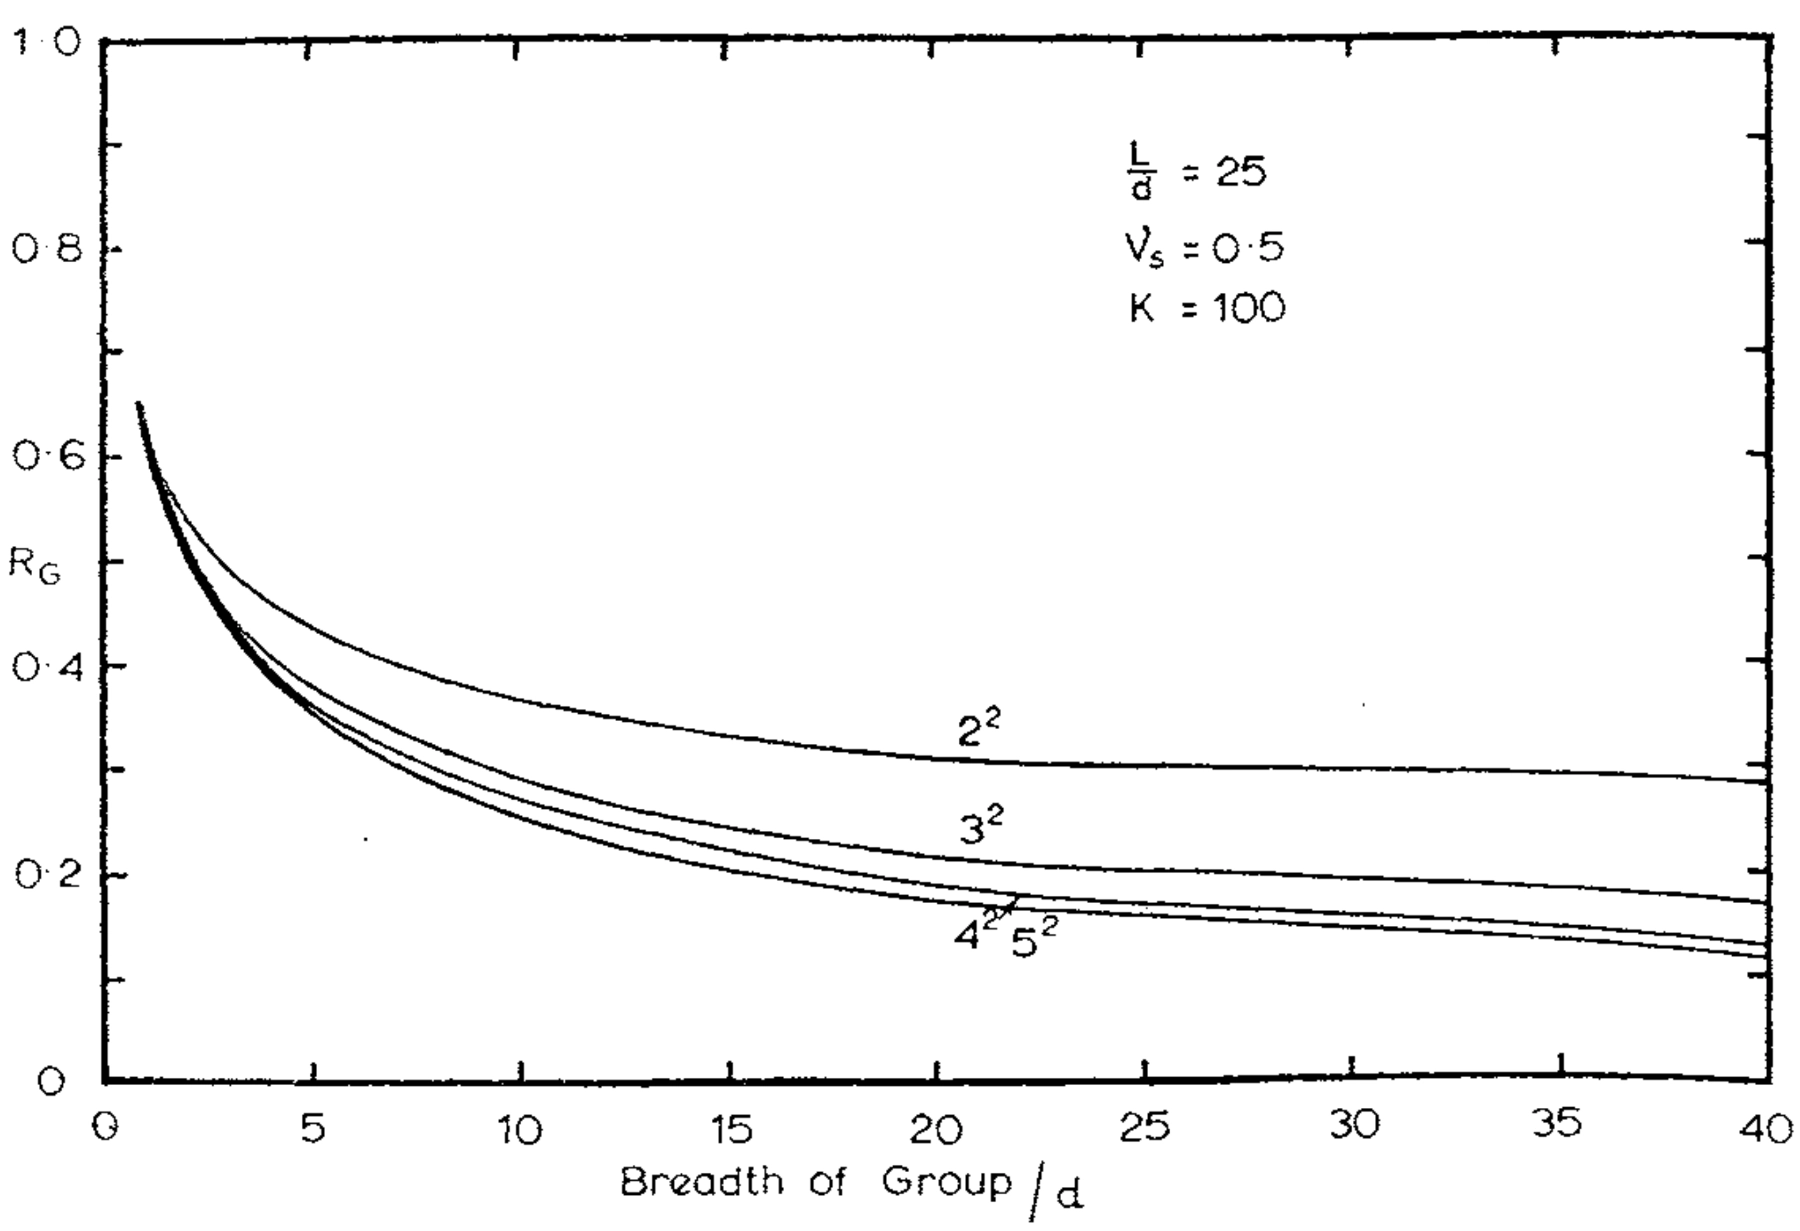
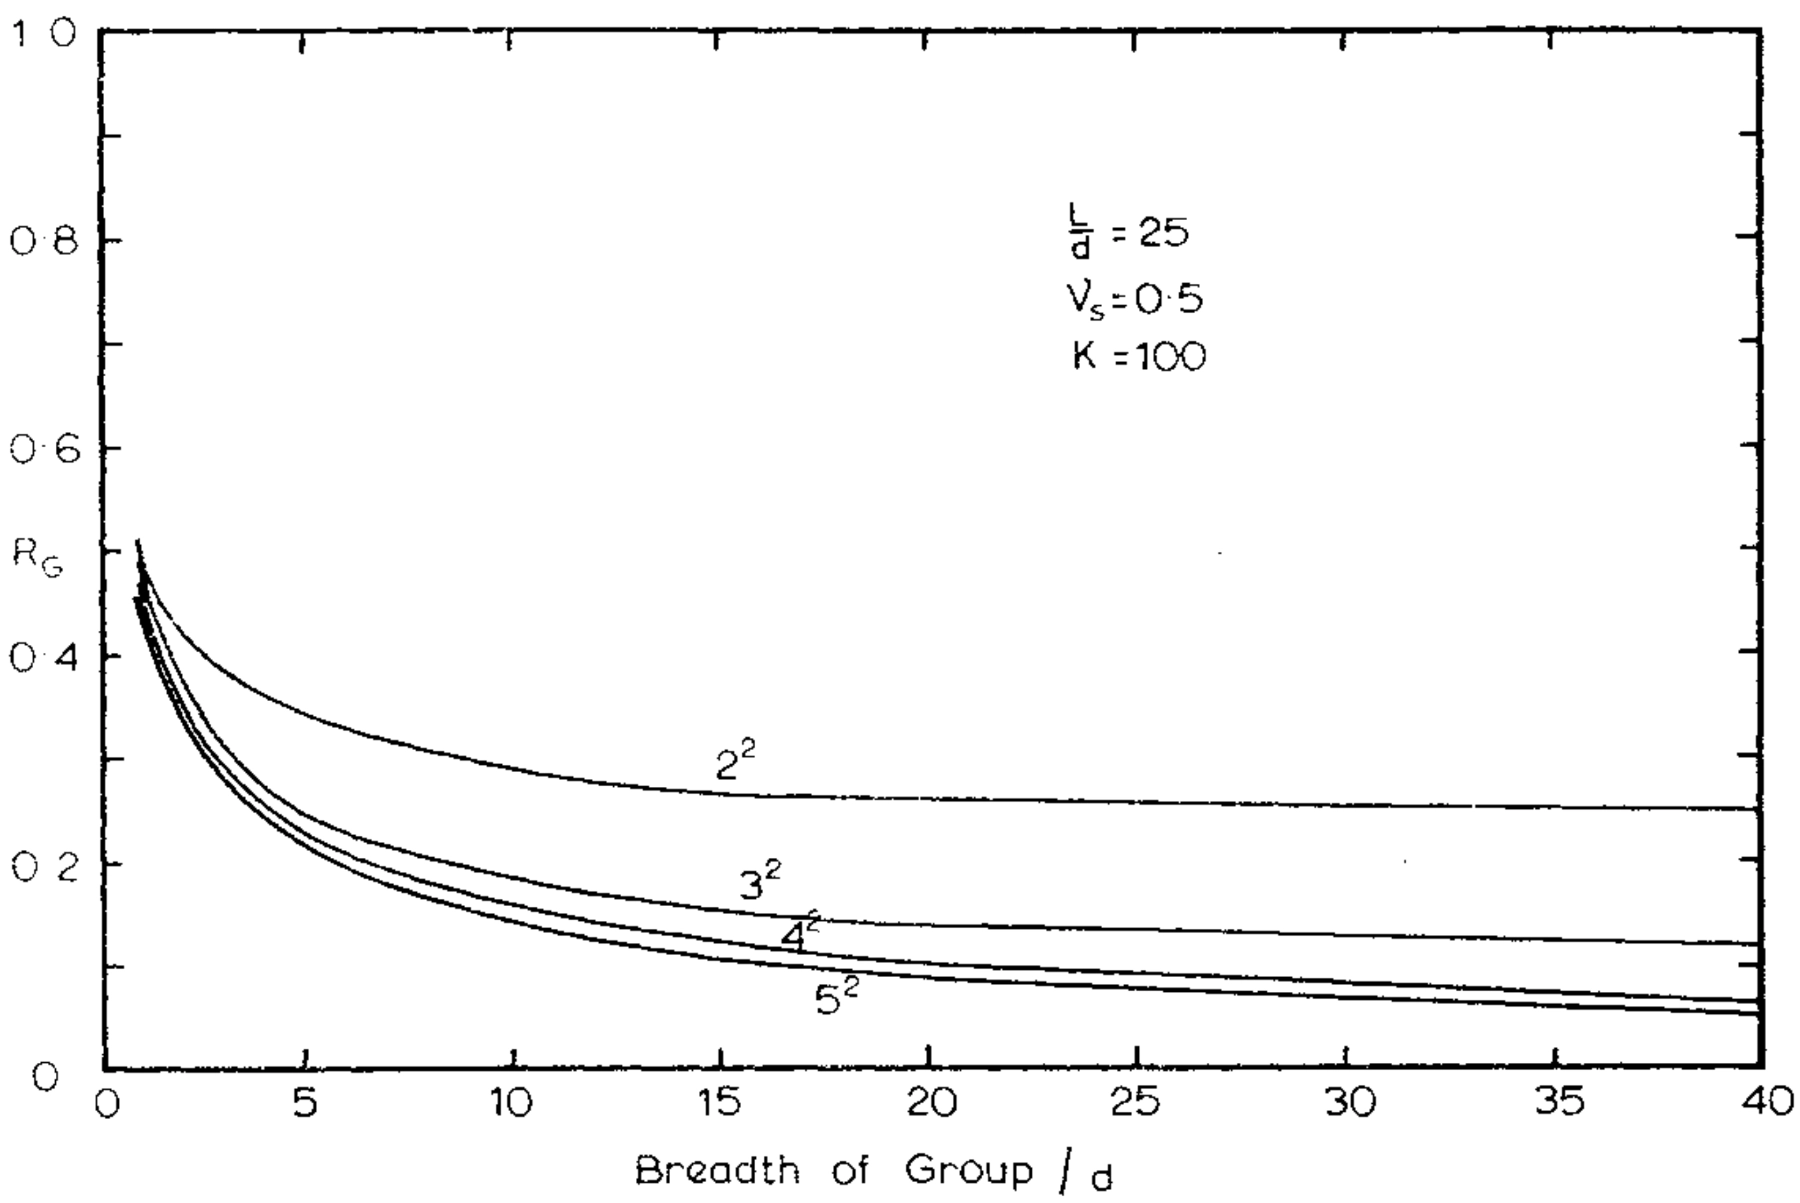
For a given spacing, decreases as the number of piles in the group increases. If however is plotted against total group breadth, as in Fig. 3, the influence of the number of piles in the group is much smaller, and for larger groups does not vary greatly with the number of piles in the group. For groups containing more than 25 piles it appears that, for a practical range of group breadths, a common limiting curve of versus breadth, almost coincident with the curve for the 52 group, is obtained. The dependence of on group breadth rather than on the actual number of piles has also been noted by Poulos (Ref. 9) for incompressible groups.
For a pile group in an ideal two-phase elastic soil mass, it is possible to calculate the ratio of immediate to total final settlement. , as described by Poulos and Davis (Ref. 10). It is found that for compressible groups the major portion of total final settlement occurs as immediate settlement and that pile compressibility has little influence on the value of .
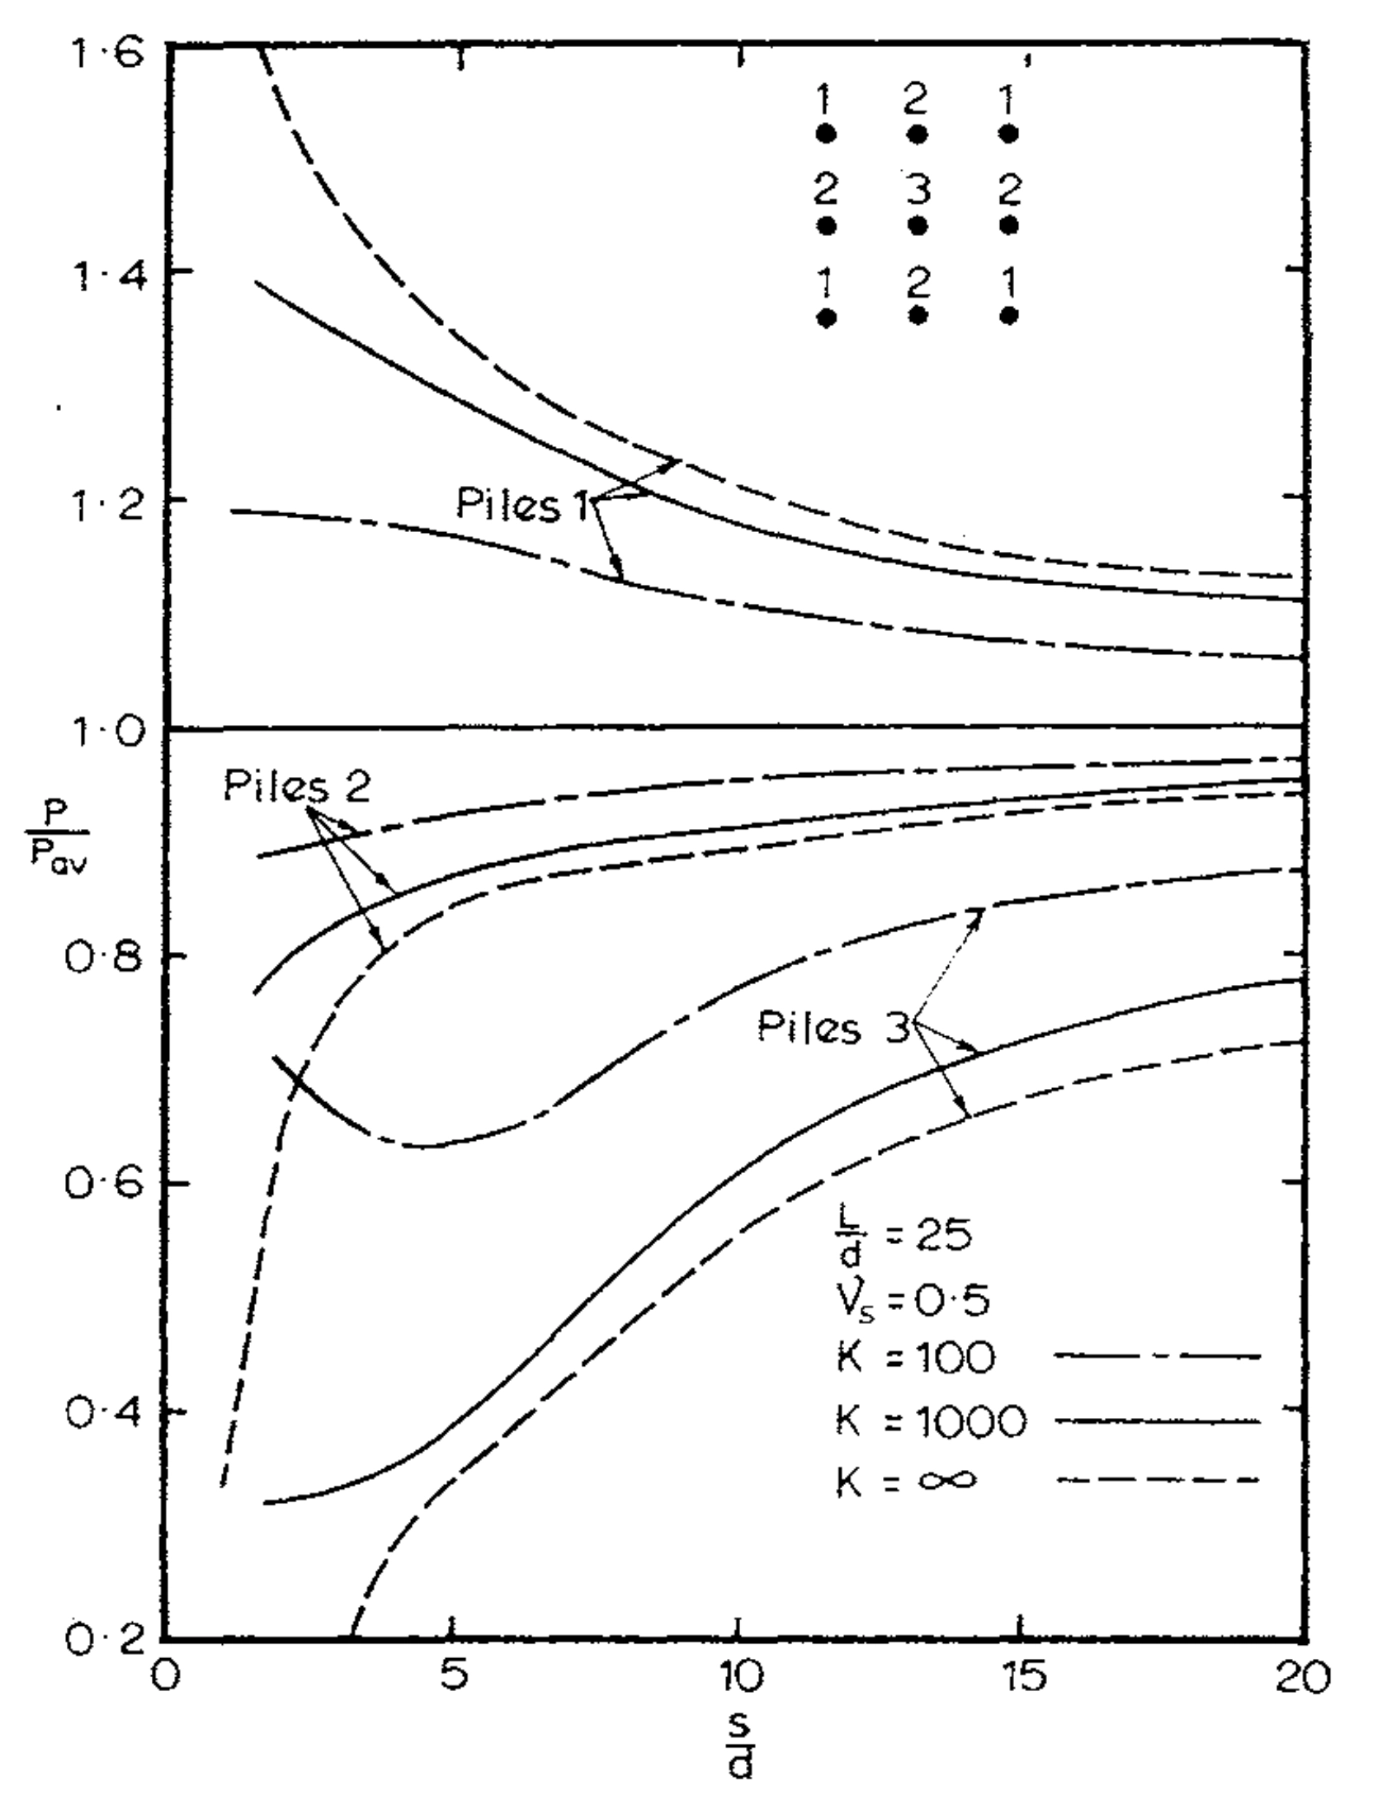
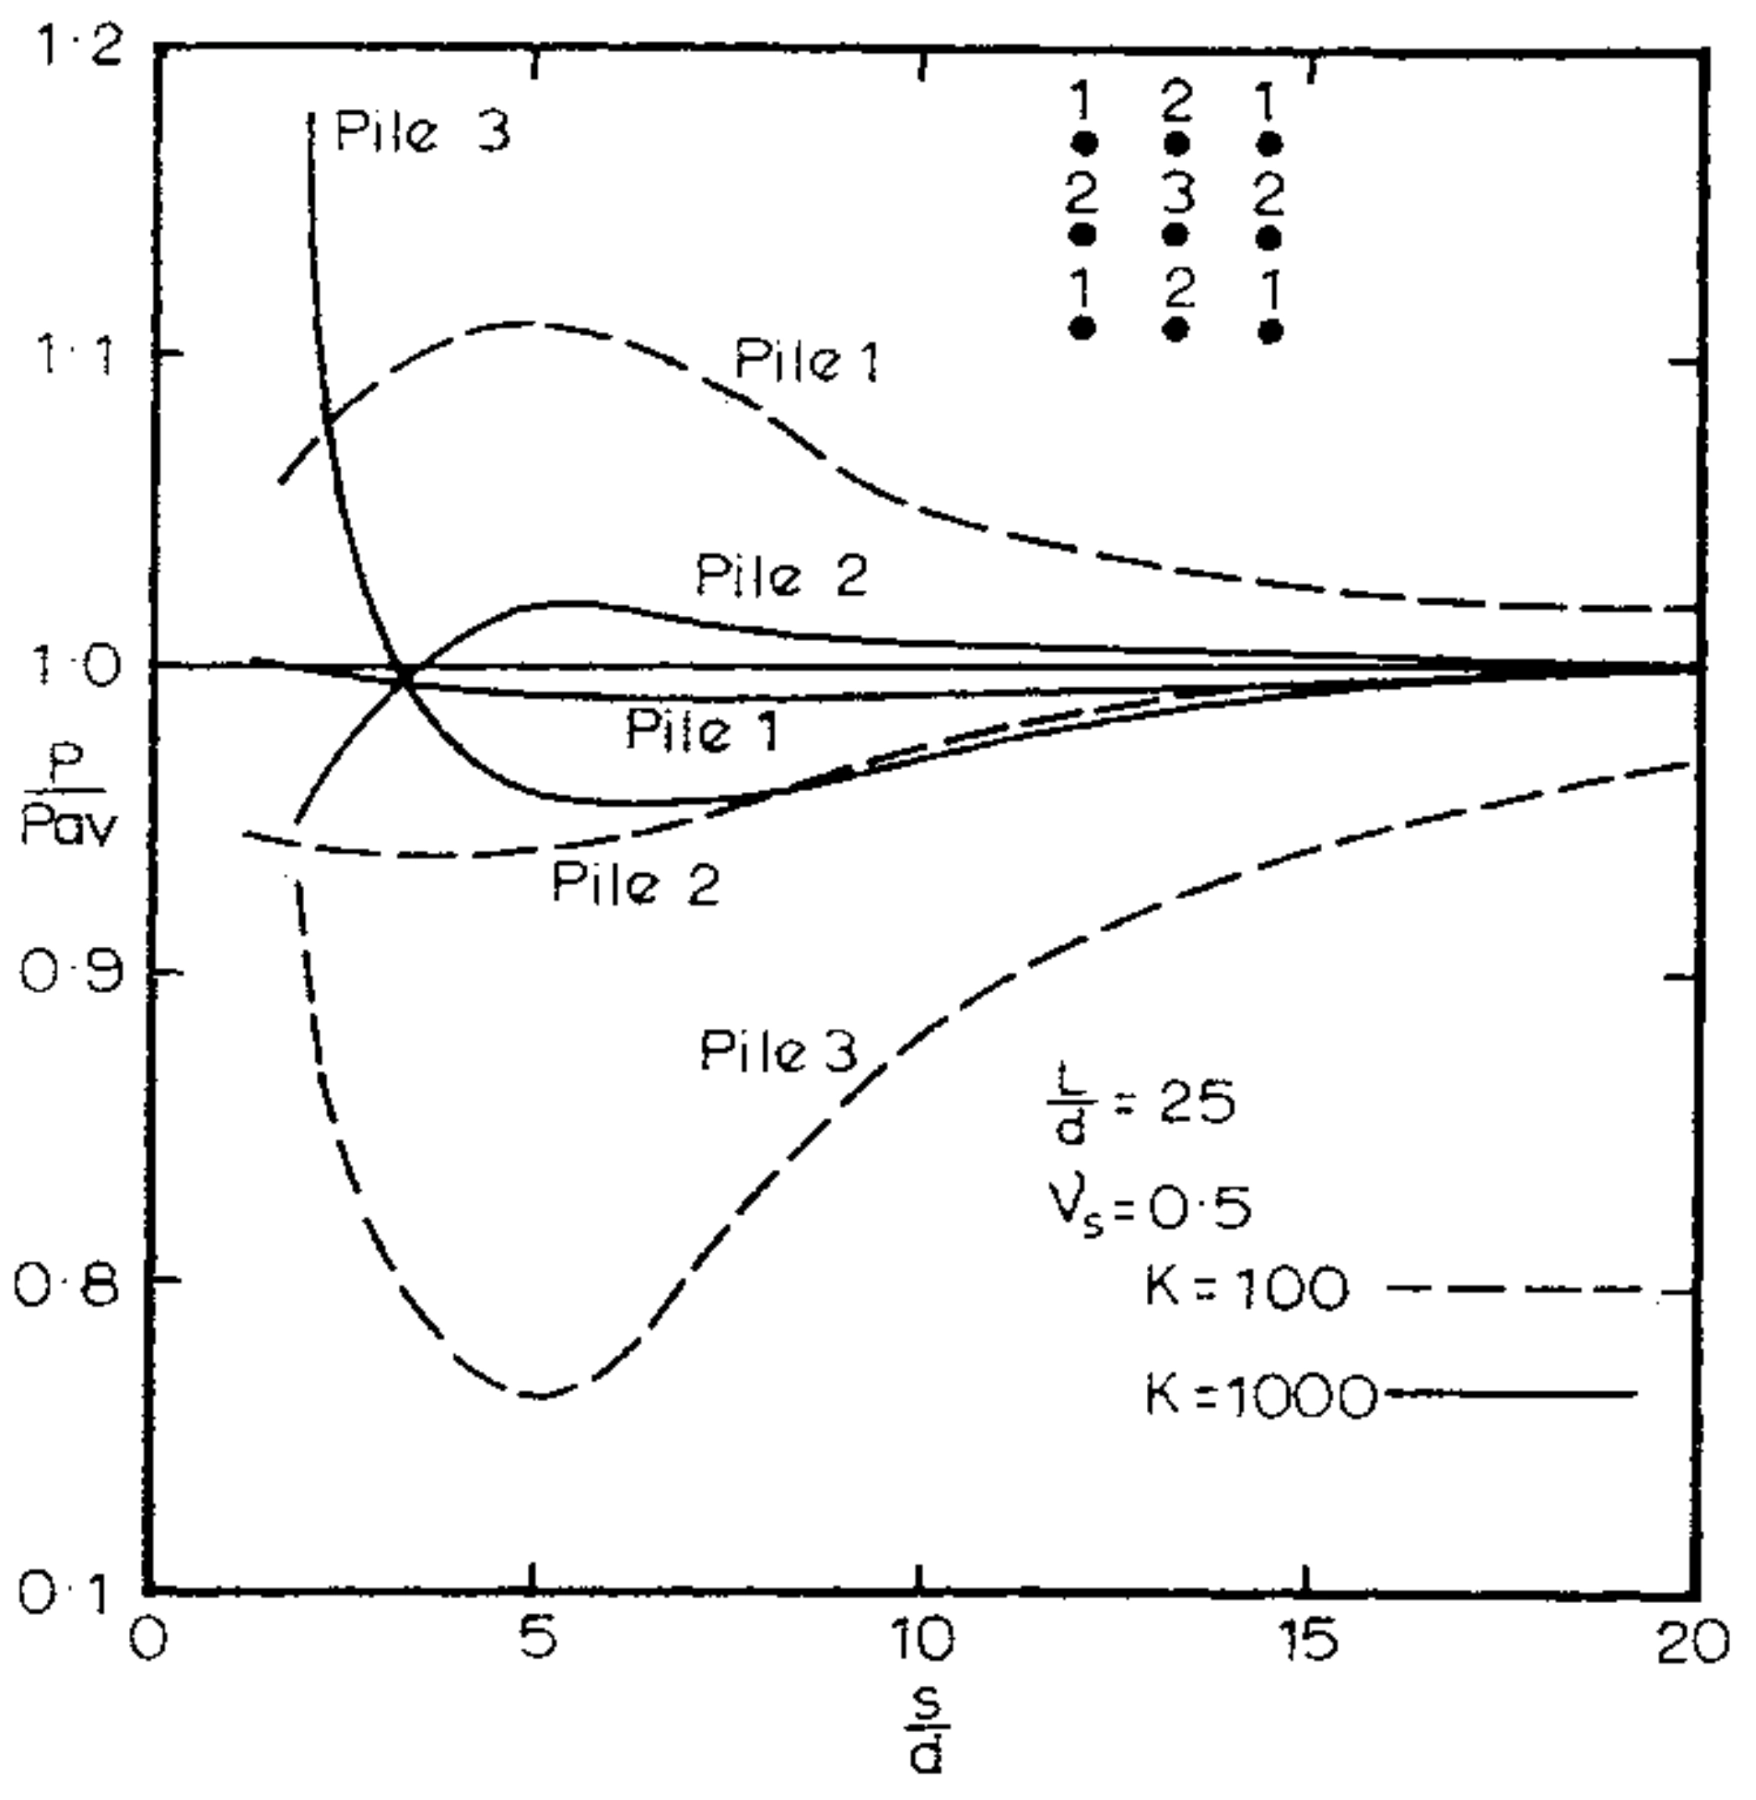
Typical load distributions within a floating pile group with a rigid cap are plotted against pile spacing in Fig. 4 for a 32 group, for = 100, 1000 and 00, the pile load being expressed as a fraction of the average pile load in the group. The outer piles take the greatest load while the inner pile takes the least and as with incompressible groups, the non-uniformity of the load distribution becomes more pronounced as increases and the number of piles in the group increases. Table B1 in Appendix B gives load distributions within a floating pile group for a wide range of , , and group size.
For groups in which all piles are equally loaded, the maximum settlement occurs at the centre pile or piles, and the minimum at the comer piles. It is found that the ratio of the maximum settlement of a group to the uniform settlement of the corresponding group with a rigid pile cap is almost independent of pile compressibility, so that values of this ratio tabulated by Poulos (Ref. 9) for incompressible groups may be used for all values of .
The ratio of the maximum differential settlement between the centre and comer piles of the group, to the settlement of the corresponding group with a rigid cap, is tabulated in Table III, for and groups with 10, 25 and 100. Although the values in Table III are for a pile stiffness factor of 1,000, it has been found that pile compressibility has little effect on , so that the factors in Table III can be used with sufficient accuracy for all values of .
| 10 | 25 | 100 | ||||
|---|---|---|---|---|---|---|
| Group size | ||||||
| 2 | 0.155 | 0.310 | 0.110 | 0.208 | 0.045 | 0.117 |
| 5 | 0.204 | 0.340 | 0.163 | 0.286 | 0.108 | 0.206 |
| 10 | 0.170 | 0.280 | 0.170 | 0.312 | 0.130 | 0.226 |
| 20 | 0.111 | 0.230 | 0.153 | 0.277 | 0.121 | 0.225 |
Differential Settlement of Floating Pile Group
Values of
5.2 End-Bearing Groups:
Group reduction factors for end-bearing pile groups with rigid caps are given in Table IV for a wide range of , , group size and . In general, decreases as pile stiffness increases. The smaller the value of Lid the closer the spacing at Which reaches its limiting value of 11m (i.e., no interaction between the piles). As with floating groups, decreases as the number of piles in the group increases, but if is plotted against total group breadth, as in Fig. 5, it will be seen that again there appears to be a limiting curve as the number of piles in the group increases.
As similarly found by Poulos and Mattes (Ref. 11) for a single end-bearing pile, the theoretical ratio of the immediate to total final settlement for groups of end-bearing piles is close to unity; for almost all cases likely to be met in practice, the time-dependent movement is less than 10% of the total final movement.
Typical load distributions within a end-bearing group are shown in Fig. 6. As with the floating group, the non-uniformity in the load distribution increases as increases, but in contrast to the corresponding floating groups, the load distribution generally becomes more uniform as pile stiffness increases. A wide range of load distributions is tabulated in Table B2 in Appendix B.
For end-bearing groups in which all piles are equally loaded, the maximum displacement generally occurs at the centre and the minimum at the corner. The ratios and both decrease as pile stiffness increases, and approach their limiting values of 1 and 0 respectively at relatively close pile spacings. Values of are given in Table V for relatively compressible piles ( = 100).
6.—COMPARISONS BETWEEN THEORETICAL AND OBSERVED GROUP BEHAVIOUR
In order to assess the applicability of the theoretical approach to field cases, it is desirable to compare the theoretical solutions with the published results of observations on model and full-scale pile groups. Such a comparison was made by Poulos (Ref. 9), but no distinction was made between piles having different values of , all piles being assumed to be incompressible. However, it is possible in some cases to estimate values of from the published data, and a summary of these cases is given in Table VI.
| Group Size | |||||||||||||||||
|---|---|---|---|---|---|---|---|---|---|---|---|---|---|---|---|---|---|
| 10 | 100 | 1000 | 10 | 100 | 1000 | 10 | 100 | 1000 | 10 | 100 | 1000 | ||||||
| 10 | 2 | 0.379 | 0.285 | 0.250 | 0.250 | 0.224 | 0.146 | 0.111 | 0.111 | 0.149 | 0.093 | 0.400 | 0.062 | 0.190 | 0.288 | 0.040 | 0.040 |
| 5 | 0.287 | 0.270 | 0.252 | 0.250 | 0.137 | 0.124 | 0.113 | 0.111 | 0.081 | 0.071 | 0.234 | 0.062 | 0.107 | 0.159 | 0.041 | 0.040 | |
| 10 | 0.256 | 0.252 | 0.250 | 0.250 | 0.115 | 0.113 | 0.111 | 0.111 | 0.065 | 0.063 | 0.154 | 0.062 | 0.074 | 0.101 | 0.040 | 0.040 | |
| 20 | 0.250 | 0.250 | 0.250 | 0.250 | 0.111 | 0.111 | 0.111 | 0.111 | 0.062 | 0.062 | 0.109 | 0.062 | 0.056 | 0.069 | 0.040 | 0.040 | |
| 0.250 | 0.250 | 0.250 | 0.250 | 0.111 | 0.111 | 0.111 | 0.111 | 0.062 | 0.062 | 0.062 | 0.062 | 0.040 | 0.040 | 0.040 | 0.040 | ||
| 25 | 2 | 0.471 | 0.405 | 0.263 | 0.250 | 0.316 | 0.286 | 0.129 | 0.111 | 0.205 | 0.205 | 0.456 | 0.062 | 0.216 | 0.290 | 0.060 | 0.040 |
| 5 | 0.341 | 0.341 | 0.271 | 0.250 | 0.186 | 0.189 | 0.129 | 0.111 | 0.125 | 0.125 | 0.310 | 0.062 | 0.118 | 0.179 | 0.051 | 0.040 | |
| 10 | 0.284 | 0.288 | 0.259 | 0.250 | 0.137 | 0.140 | 0.118 | 0.111 | 0.083 | 0.083 | 0.214 | 0.062 | 0.079 | 0.119 | 0.043 | 0.040 | |
| 20 | 0.259 | 0.259 | 0.251 | 0.250 | 0.116 | 0.117 | 0.112 | 0.111 | 0.066 | 0.066 | 0.147 | 0.062 | 0.059 | 0.080 | 0.040 | 0.040 | |
| 0.250 | 0.250 | 0.250 | 0.250 | 0.111 | 0.111 | 0.111 | 0.111 | 0.062 | 0.062 | 0.062 | 0.062 | 0.040 | 0.040 | 0.040 | 0.040 | ||
| 100 | 2 | 0.636 | 0.565 | 0.452 | 0.250 | 0.489 | 0.439 | 0.338 | 0.111 | 0.390 | 0.368 | 0.406 | 0.062 | 0.339 | 0.336 | 0.256 | 0.040 |
| 5 | 0.463 | 0.459 | 0.418 | 0.250 | 0.301 | 0.308 | 0.280 | 0.111 | 0.221 | 0.234 | 0.311 | 0.062 | 0.187 | 0.207 | 0.178 | 0.040 | |
| 10 | 0.359 | 0.373 | 0.365 | 0.250 | 0.204 | 0.221 | 0.220 | 0.111 | 0.138 | 0.155 | 0.238 | 0.062 | 0.118 | 0.139 | 0.124 | 0.040 | |
| 20 | 0.296 | 0.310 | 0.317 | 0.250 | 0.149 | 0.165 | 0.173 | 0.111 | 0.093 | 0.107 | 0.155 | 0.062 | 0.080 | 0.094 | 0.085 | 0.040 | |
| 0.250 | 0.250 | 0.250 | 0.250 | 0.111 | 0.111 | 0.111 | 0.111 | 0.062 | 0.062 | 0.062 | 0.062 | 0.040 | 0.040 | 0.040 | 0.040 | ||
End-Bearing Pile Groups, Rigid Cap. Group Reduction Factor,
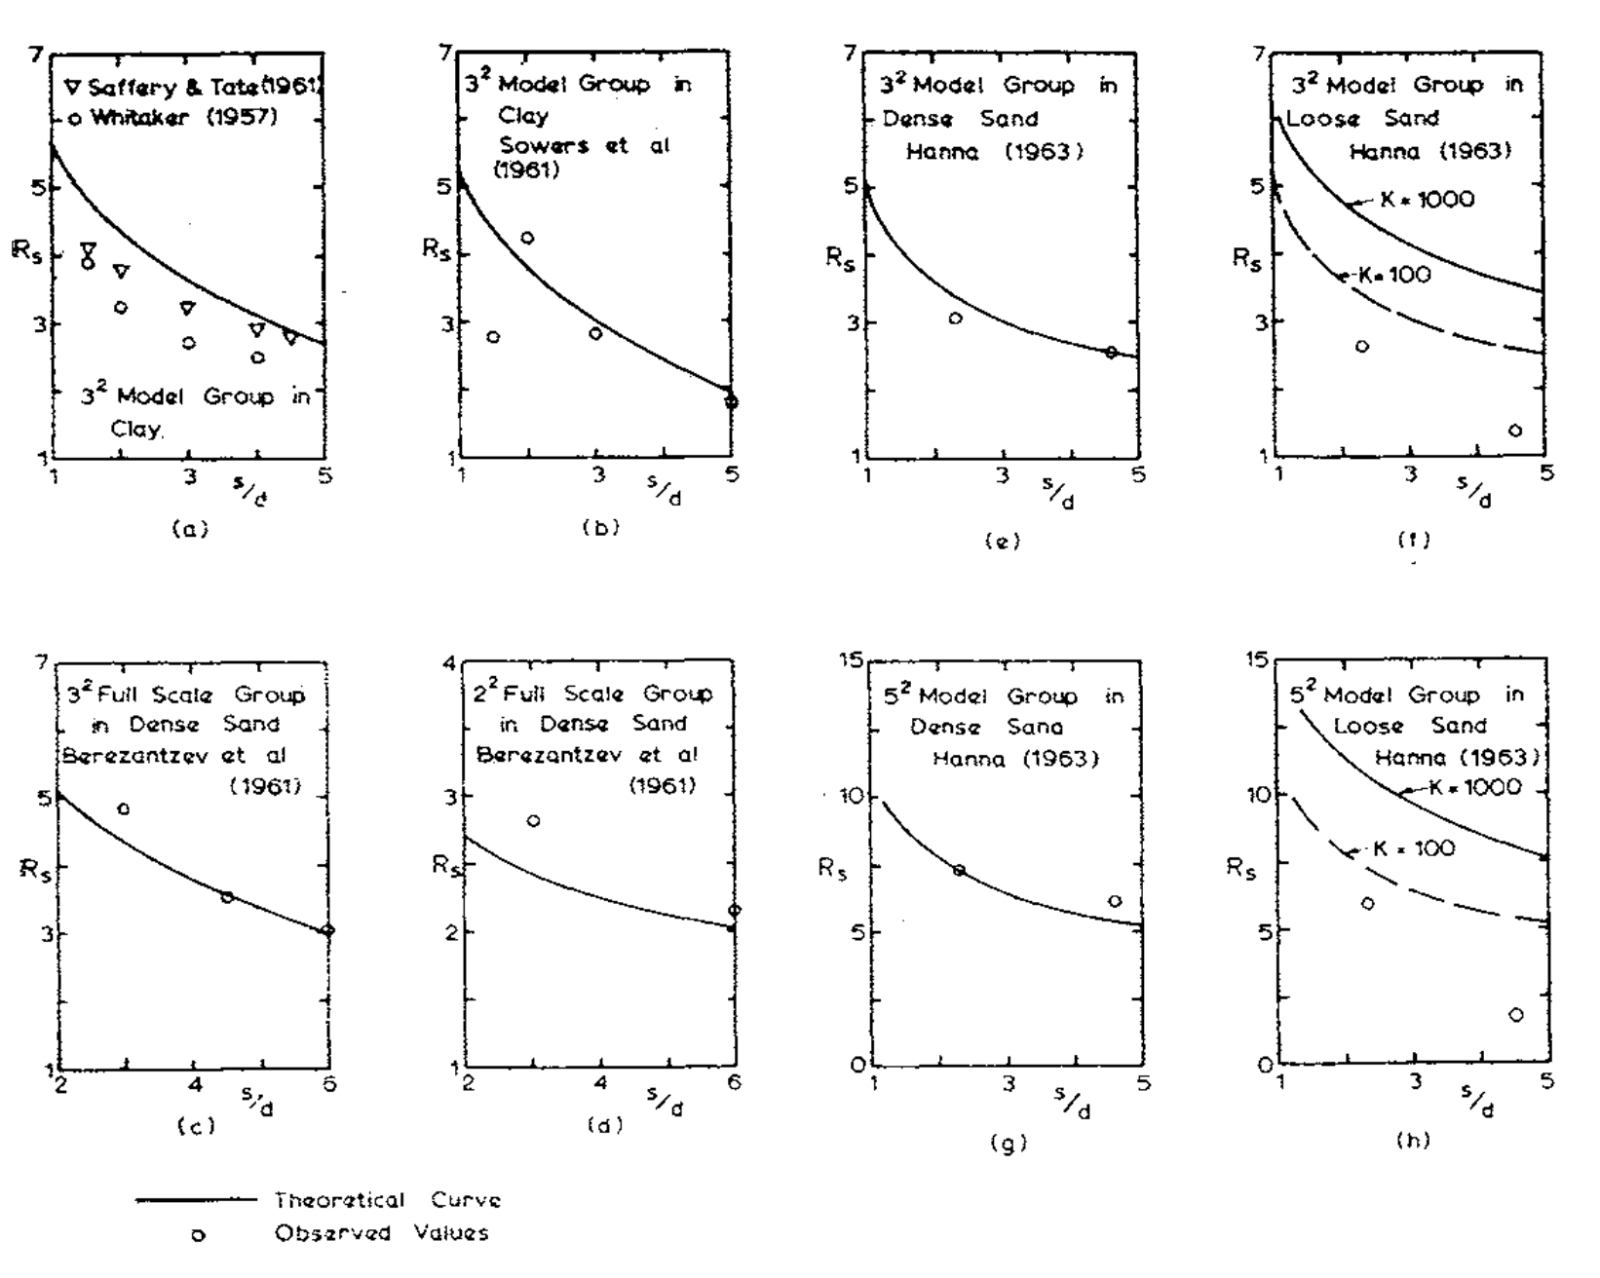
In all cases, floating pile groups are considered. Comparisons between observed settlement ratios for square pile groups and those calculated theoretically are shown in Fig. 7. In all cases, the load level corresponds to a factor of safety of at least 2 against overall failure. It will be seen that with the exception of the tests by Hanna (Ref. 5) in loose sand, the general agreement is quite satisfactory for both large and small values of .
| 10 | 25 | 100 | ||||
|---|---|---|---|---|---|---|
| Group size | ||||||
| 2 | 0.103 | 0.197 | 0.059 | 0.254 | 0.096 | 0.236 |
| 5 | 0.082 | 0.150 | 0.181 | 0.370 | 0.179 | 0.336 |
| 10 | 0.001 | 0.001 | 0.129 | 0.240 | 0.181 | 0.296 |
| 20 | 0 | 0 | 0.041 | 0.043 | 0.113 | 0.236 |
Differential Settlement of End-Bearing Pile Group
Values of
The comparisons between theoretical and observed values of for the tests carried out by Hanna (Ref. 5) on wooden piles in initially loose sand (Figs. 7 (f) and 7 (h)), were made using a value of estimated from the value of for loose sand. It was found that the observed values were much less than the theoretical and this discrepancy is probably due to a greater degree of densification occurring near the group than near the single piles. However, if the value of corresponding to dense sand is used for the theoretical values of , the agreement is closer, although is still over-estimated, especially at larger spacings. The less satisfactory agreement for groups in loose sand is not surprising since the local densification around the pile groups leads to inhomogeneity of the sand mass, the extent of this inhomogeneity varying as the pile spacing varies. Because of this inhomogeneity, the sand departs considerably from the ideal homogeneous elastic soil assumed in the analysis.
Comparisons between observed and theoretical load distributions within pile groups have been made by Poulos (Ref. 9), In the cases considered, the piles were effectively incompressible and the agreement between observed and theoretical distributions was found to be close, To the authors’ knowledge, no further cases involving relatively low values of are readily available.
The comparisons shown in Fig. 7, and those obtained previously by Poulos (Ref. 9) suggest that the theoretical approach described in this paper is capable of predicting with reasonable accuracy the settlement ratio and pile load distribution at working loads in practical problems. Some caution however appears desirable in applying the theory to pile groups in initially loose sand.
While no data is available on groups of end-bearing piles, the above comparisons, together with those made by Poulos and Mattes (Ref. 11) for a single end-bearing pile, suggest that a similar measure of agreement between theory and observation may be expected for end-bearing groups. A more reliable assessment of the applicability of the theory must however await results of further field measurements.
7.-APPLICATION OF THEORETICAL SOLUTIONS TO PRACTICAL PROBLEMS
In order to use the preceding theoretical solutions to estimate the immediate and total final settlement of a pile group, it is necessary to determine representative values of the ‘elastic’ parameters of the soil. The immediate settlement is given by putting equal to the undrained Young’s modulus of the soil and using the displacement influence factors and interaction factors for the undrained value of Poisson’s ratio , which is 0.5 for saturated clays. The total final settlement is given by putting equal , the Young’s modulus of the soil skeleton, and using the displacement influence factors and interaction factors for , Poisson’s ratio of the soil skeleton. Although it is possible to carry out triaxial tests in order to determine representative values of , and (Kefs. 3, 4 and 6), the initial and final stress states in the soil near a loaded pile are difficult to estimate, and consequently, the reliability of soil parameters determined in laboratory tests must at present be considered dubious. It would appear that a more satisfactory means of obtaining values of , and is to carry out an actual loading test on a single pile, the results of which may be fitted to the theoretical solutions for the settlement of a single pile to determine the required parameters. These parameters may then be used for calculating the immediate and total final settlement of the pile group.
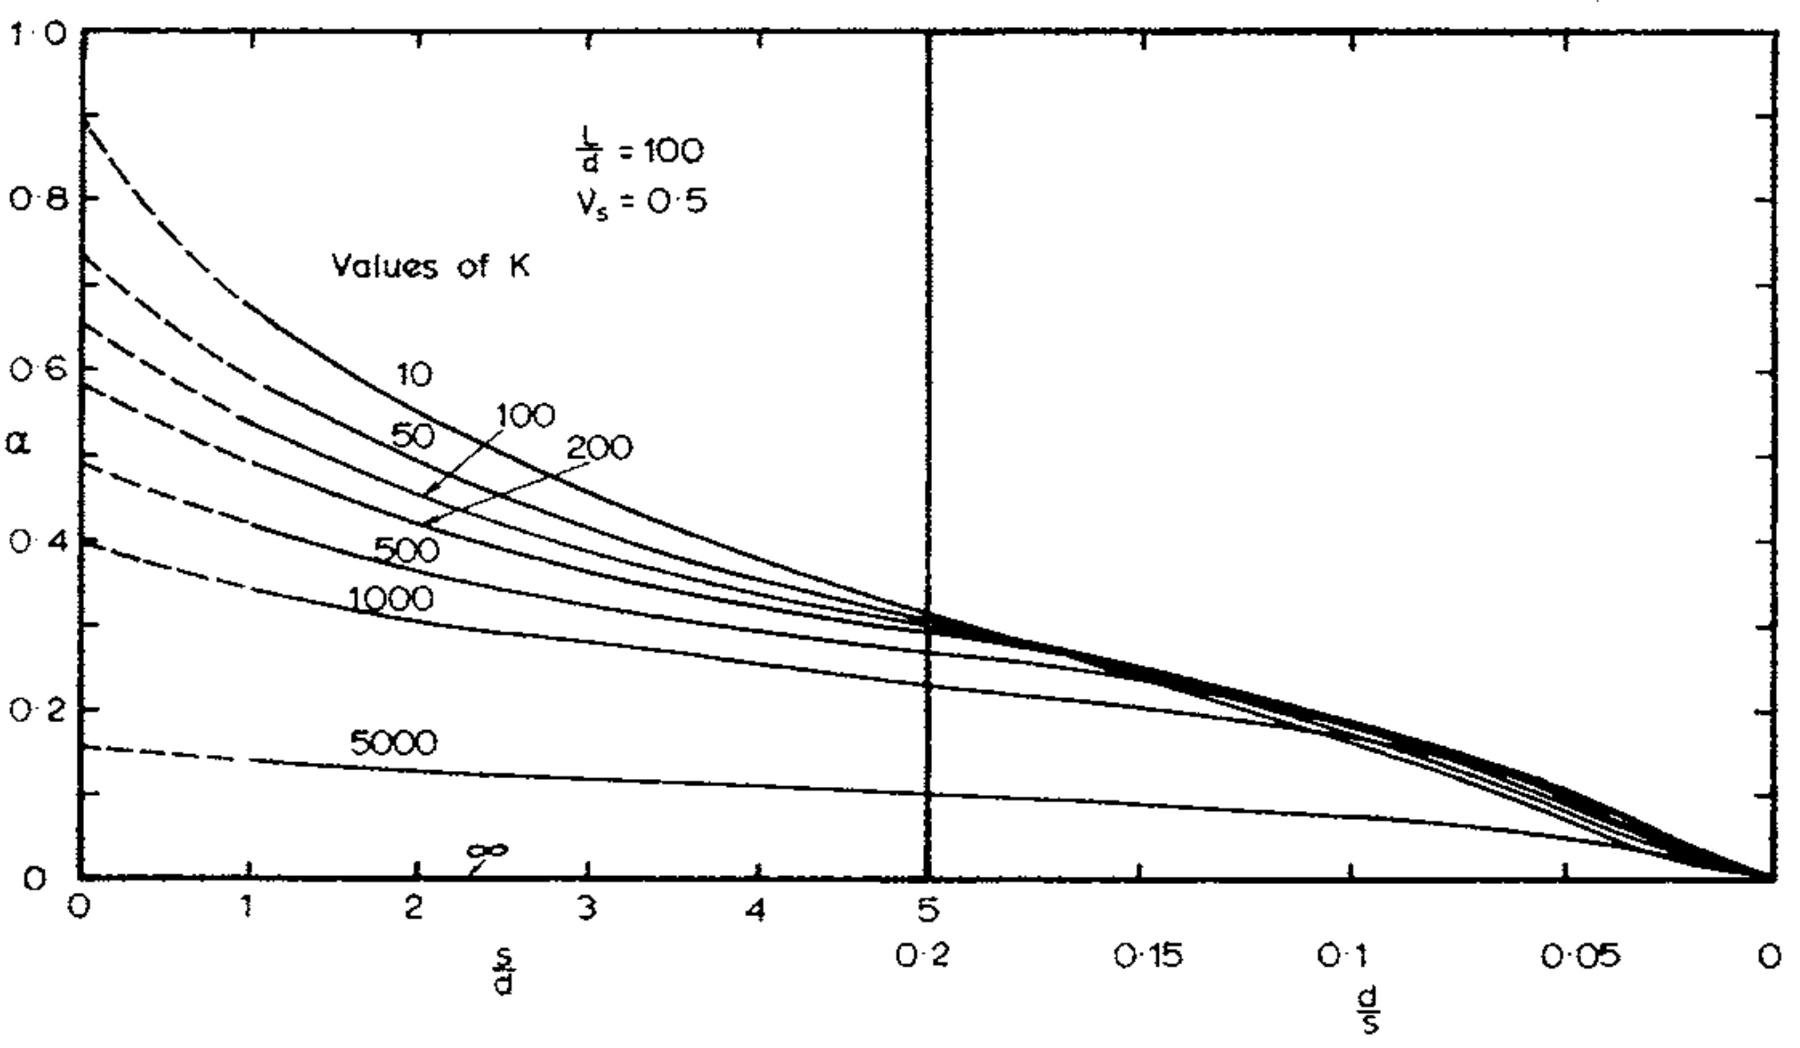
In order to estimate the settlement of the group on a theoretical basis, it is necessary to use the influence factors for the top displacement of a single compressible pile. These have been presented by Poulos and Mattes (Ref. 11) for end-bearing piles and Mattes and Poulos (Ref. 7) for floating piles. For convenience, these influence factors are summarized in Tables VII and VIII for . In both cases, the variation of the influence factors with is relatively small so that, for practical purposes, the values in Tables II and III may be used for all values of .
| 10 | 25 | 100 | |
|---|---|---|---|
| 10 | 3.26 | 6.78 | 14.45 |
| 50 | 2.05 | 4.46 | 12.00 |
| 100 | 1.80 | 3.58 | 10.61 |
| 500 | 1.49 | 2.34 | 6.60 |
| 1000 | 1.44 | 2.10 | 5.18 |
| 5000 | 1.41 | 1.90 | 3.26 |
| 1.40 | 1.89 | 2.70 |
Displacement Influence Factors for a Single Floating Pile in a Semi-Infinite Mass
Top Displacement
Values of
| 10 | 25 | 100 | |
|---|---|---|---|
| 10 | 3.26 | 6.78 | 14.45 |
| 50 | 2.05 | 4.46 | 12.00 |
| 100 | 1.80 | 3.58 | 10.61 |
| 500 | 1.49 | 2.34 | 6.60 |
| 1000 | 1.44 | 2.10 | 5.18 |
| 5000 | 1.41 | 1.90 | 3.26 |
| 1.40 | 1.89 | 2.70 |
Displacement Influence Factors for a Single End-Bearing Pile Resting on a Rigid Stratum
Top Displacement
It is also necessary to estimate a value of the pile stiffness factors in order to use the theoretical solution. Since the value of of the soil will change from to as dissipation of excess pore pressures occurs around the pile, the value of will also change during the consolidation process. However, this change in is likely to be relatively small and, in view of the uncertainties involved in obtaining values of , may be ignored. As a guide for practical problems, typical values of for solid steel, concrete and timber piles in various types of soil were suggested by Poulos and Mattes (Ref. 11) and are reproduced in Table IX. It will be seen that, for solid piles, low values of occur only with concrete or timber piles in stiff clays and dense sands. However, low values of can also occur with steel pipe piles which typically have an area ratio of 0.1 to 0.2, and for compacted sand piles, for which may be as low as about 10. For such cases, the compressibility of the pile may significantly influence the behaviour of the pile group, especially if the piles are slender.
It must be borne in mind that the theoretical solutions presented in this paper are strictly only applicable to uniform soil deposits, and that various practical aspects are not taken into account by the present theory, for example, the influence of the method of pile installation, non-homogeneity and anisotropy of the soil, and layering of the soil profile. The application of the theoretical solutions to such field situations therefore requires a certain amount of engineering judgment in order to successfully reduce the actual problem to an idealized one for the purposes of analysis. It should also be reiterated that the piles are assumed free-standing and no account is taken of raft action of the pile cap.
However, preliminary analyses have revealed that, at normal pile spacings, the influence of the pile cap resting on the surface on the behaviour of the group at working loads is relatively minor, although at loads approaching the ultimate, the pile cap may largely dictate the behaviour of the group. Another important factor not taken into account in the present analysis is the possibility of increased settlements due to deep-seated compressible layers situated beneath a floating pile group. A method for calculating such settlements will be presented in a subsequent paper.
8.—CONCLUSIONS
The displacement and load distribution within groups of compressible floating end-bearing piles has been analysed by employing the method of superposition as previously applied to incompressible floating pile groups. The influence of the relative compressibility of the piles on the behaviour of groups has been examined in relation to square groups of piles, and it has been found that for floating pile groups, the group reduction factor decreases as the pile stiffness factor decreases. For a group with a rigid pile cap, the load distribution within the group becomes more uniform as decreases.
For end-bearing groups, the interaction between the piles in the group increases as the piles become more compressible, and consequently, the group reduction factor increases as decreases, while the load distribution within a group with a rigid pile cap becomes less uniform.
As with incompressible floating pile groups, it is found that the group settlement is dependent more on the total breadth of the group than on the number of piles in the group, and that the major proportion of the total final settlement occurs immediately for both floating and end-bearing groups.
Comparisons between theoretical values of settlement ratios and values observed in model and field tests on floating pile groups show generally good agreement and suggest that, with the possible exception of pile groups in loose sand, the theory is capable of predicting with reasonable accuracy the settlement ratio and pile load distribution at working loads in practical problems.
ACKNOWLEDGMENTS
The work described in this paper forms part of a general programme of research into the settlement of all types of foundations, being carried out at the University of Sydney under the general direction of Professor E. H. Davis, Professor of Civil Engineering (Soil Mechanics). The work is supported by a research grant from the Australian Research Grants Committee, and by the award of a Commonwealth Research Scholarship to the second author. The computational work was carried out using the facilities of the Basser Computing Department of the School of Physics at Sydney University.
References
- BEREZANTZEV, G. V. et aI-Load Bearing Capacity and Deformation of Piled Foundations. Proc. Fifth Int. Conf. Soil Mechanics and Foundation Engg., Paris, 17-22 July, 1961, Vol. 2, pp. 11-15.
- D’APPOLONIA, E. and ROMUALDI, J. P.-Load Transfer in End-Bearing Steel H-Piles. Proc. A.S.C.E., Jour. Soil Mechanics and Foundations Div., Vol. 89, No. SM2, March, 1963, pp. 1-25.
- DAVIS, E. H. and POULOS, H. G.-Triaxial Testing and Three-Dimensional Settlement Analysis. Proc. Fourth Aust.-New Zealand Conj. Soil Mechanics and Foundation Engg., Adelaide, 1963, pp. 233-43.
- DAVIS, E. H. and POULOS, H. G.-The Use of Elastic Theory for Settlement Prediction under Three-Dimensional Conditions. Geotechnique,. Vol. 18, No.1, 1968, pp. 67-91.
- HANNA, T. H.-Model Studies of Foundation Groups in Sand. Geotechnique, Vol. 13, No.4, 1963, pp. 334-51.
- LAMBE, T. W.-Stress Path Method. Proc. A.S.C.E., Jour. Soil Mechanics and Foundations Div., Vol. 93, No. SM6, Nov., 1967, pp. 309-31.
- MATTES, N. S. and POULOS, H. G.-The Settlement of a Single Compressible Pile. Proc. A.S.C.E., Jour. Soil Mechanics and Foundations Div., Vol. 95, No. SMl, Jan., 1969, pp. 189-207.
- PICHUMANI, R. and D’ APPOLONIA, E.-Theoretical Distribution of Loads among the Piles in a Group. Proc. Third Pan-American Conf. Soil Mechanics, Caracas, Venezuela, 1967.
- POULOS, H. G.-Analysis of the Settlement of Pile Groups. Geotechnique, Vol. 18, No.4, 1968, pp. 449-71.
- POULOS, H. G. and DAVIS, E. H.-The Settlement Behaviour of Single Axially-Loaded Incompressible Piles and Piers. Geotechnique, Vol. 18, No.3, 1968, pp. 351-71.
- POULOS, H. G. and MATTES, N. S.-The Behaviour of Axially-Loaded End Bearing Piles. Geotechnique, Vol. 19, No.2, 1969, pp. 285-300.
- SAFFERY, M. R. and TATE, A. P. K.-Model Tests on Pile Groups in a Clay Soil with Particular Reference to the Behaviour of the Group when it is Loaded EccentricaIly. Proc. Fifth Int. Conf. Soil Mechanics and Foundation Engg., Paris, 17-22 July, 1961, Vol. 2, pp. 129-34.
- SOWERS, G. F. et aI-The Bearing Capacity of Friction Pile Groups in Homogeneous Clay from Model Studies. Proc. Fifth Int. Conf. Soil Mechanics and Foundation Engg., Paris, 17-22 July, 1961, Vol. 2, pp. 155-9.
- WHITAKER, T.-Experiments with Model Piles in Groups. Geotechnique, Vol. 7, No.4, 1957, pp. 147-67.
APPENDIX A
Interaction Curves for Floating and End-Bearing Two-Pile Groups
APPENDIX B
Load Distributions within Floating and End-Bearing Groups with Rigid Pile Caps
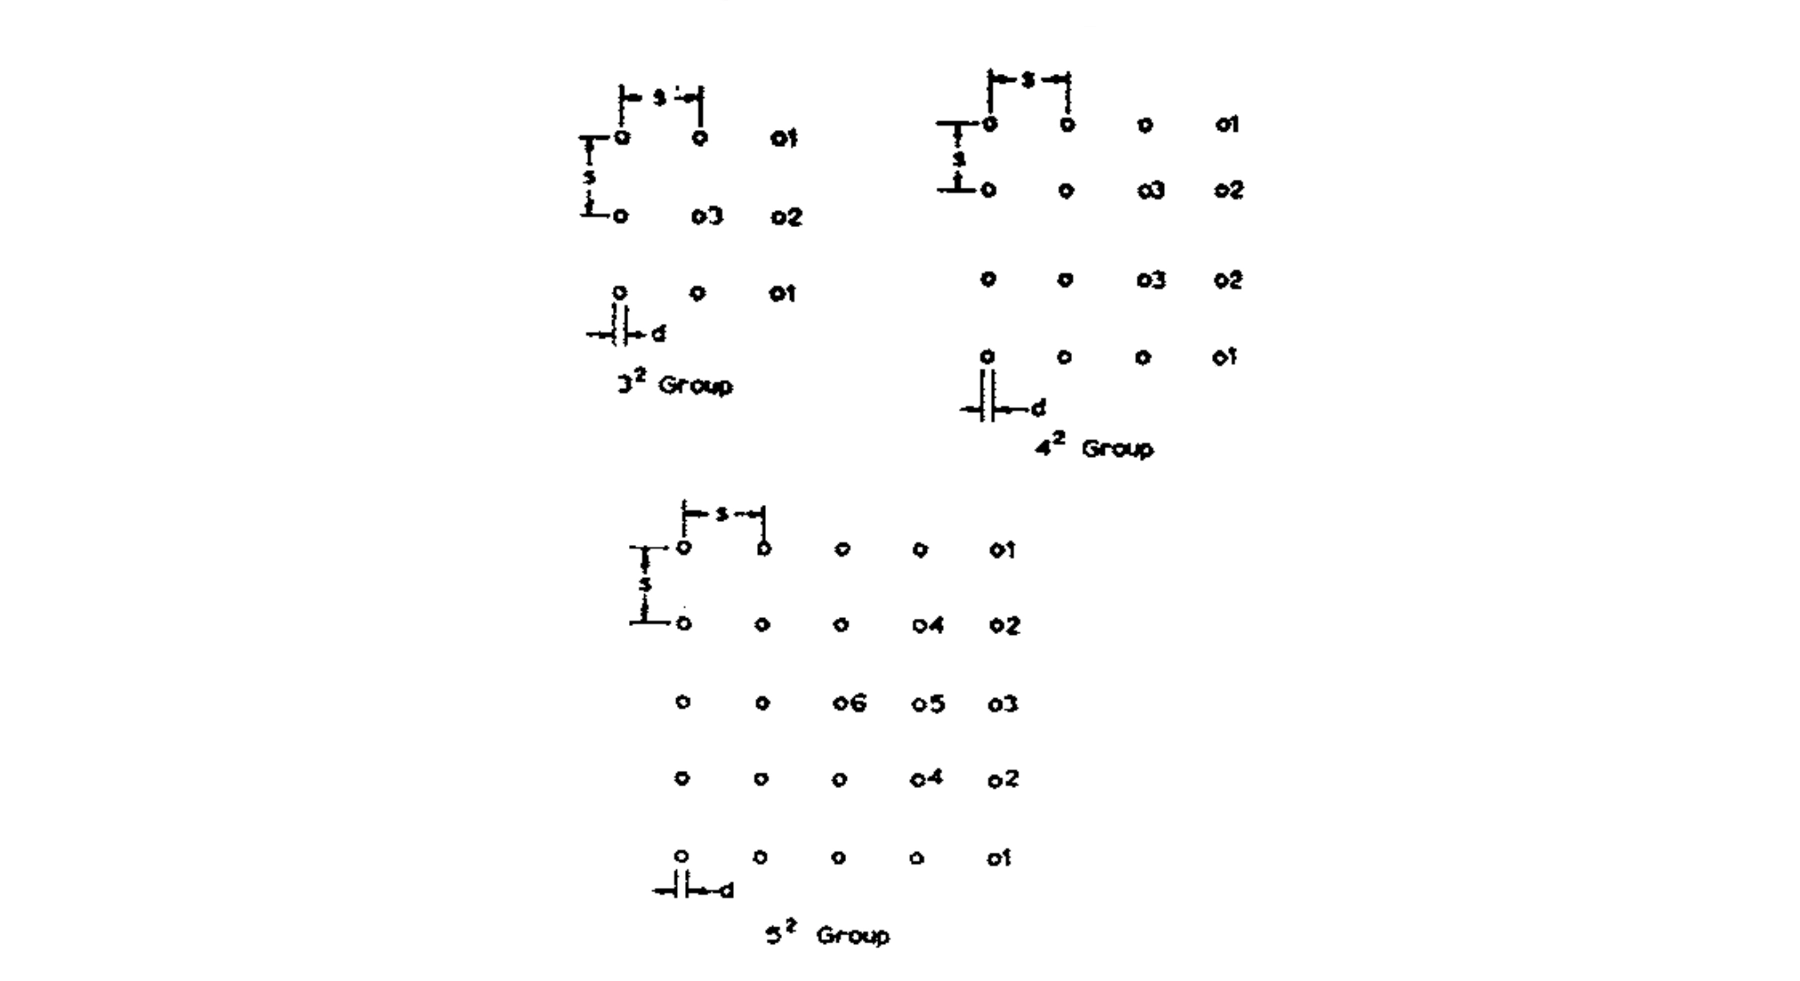
TABLE B2
| Pile 1 | Pile 2 | Pile 3 | |||||
|---|---|---|---|---|---|---|---|
| 100 | 1000 | 100 | 1000 | 100 | 1000 | ||
| 10 | 2 | 0.98 | 0.92 | 0.99 | 1.01 | 1.11 | 1.20 |
| 5 | 1.02 | 1.00 | 0.99 | 1.00 | 0.94 | 1.00 | |
| 10 | 1.00 | 1.00 | 1.00 | 1.00 | 1.00 | 1.00 | |
| 20 | 1.00 | 1.00 | 1.00 | 1.00 | 1.00 | 1.00 | |
| 25 | 2 | 1.07 | 0.95 | 0.94 | 1.00 | 0.93 | 1.17 |
| 5 | 1.11 | 1.02 | 0.94 | 0.99 | 0.76 | 0.96 | |
| 10 | 1.05 | 1.01 | 0.98 | 0.99 | 0.88 | 0.97 | |
| 20 | 1.02 | 1.00 | 1.00 | 1.00 | 0.97 | 1.00 | |
| 100 | 2 | 1.22 | 1.02 | 0.87 | 0.97 | 0.65 | 1.04 |
| 5 | 1.21 | 1.13 | 0.90 | 0.94 | 0.53 | 0.73 | |
| 10 | 1.13 | 1.10 | 0.94 | 0.95 | 0.71 | 0.78 | |
| 20 | 1.06 | 1.06 | 0.97 | 0.97 | 0.88 | 0.87 | |
| Pile 1 | Pile 2 | Pile 3 | |||||
|---|---|---|---|---|---|---|---|
| 100 | 1000 | 100 | 1000 | 100 | 1000 | ||
| 10 | 2 | 1.04 | 0.88 | 0.98 | 0.98 | 1.00 | 1.17 |
| 5 | 1.05 | 1.00 | 1.00 | 1.00 | 0.94 | 1.00 | |
| 10 | 1.00 | 1.00 | 1.00 | 1.00 | 0.99 | 1.00 | |
| 20 | 1.00 | 1.00 | 1.00 | 1.00 | 1.00 | 1.00 | |
| 25 | 2 | 1.26 | 0.95 | 0.98 | 0.98 | 0.77 | 1.10 |
| 5 | 1.23 | 1.05 | 1.01 | 1.00 | 0.75 | 0.94 | |
| 10 | 1.10 | 1.02 | 1.00 | 1.00 | 0.88 | 0.98 | |
| 20 | 1.02 | 1.00 | 1.00 | 1.00 | 0.98 | 1.00 | |
| 100 | 2 | 1.61 | 1.19 | 0.97 | 0.98 | 0.44 | 0.86 |
| 5 | 1.48 | 1.33 | 1.00 | 1.00 | 0.51 | 0.65 | |
| 10 | 1.27 | 1.23 | 1.00 | 1.00 | 0.72 | 0.75 | |
| 20 | 1.14 | 1.13 | 1.00 | 1.00 | 0.85 | 0.84 | |
| Pile 1 | Pile 2 | Pile 3 | Pile 4 | Pile 5 | Pile 6 | ||||||||
|---|---|---|---|---|---|---|---|---|---|---|---|---|---|
| 100 | 1000 | 100 | 1000 | 100 | 1000 | 100 | 1000 | 100 | 1000 | 100 | 1000 | ||
| 10 | 2 | 1.11 | 0.86 | 1.02 | 0.94 | 0.95 | 0.95 | 0.99 | 1.13 | 0.90 | 1.14 | 0.81 | 1.18 |
| 5 | 1.06 | 1.01 | 1.02 | 1.00 | 1.01 | 1.00 | 0.96 | 1.00 | 0.95 | 1.00 | 0.94 | 1.00 | |
| 10 | 1.00 | 1.00 | 1.00 | 1.00 | 1.00 | 1.00 | 1.00 | 1.00 | 1.00 | 1.00 | 1.00 | 1.00 | |
| 20 | 1.00 | 1.00 | 1.00 | 1.00 | 1.00 | 1.00 | 1.00 | 1.00 | 1.00 | 1.00 | 1.00 | 1.00 | |
| 25 | 2 | 1.55 | 0.99 | 1.12 | 0.99 | 0.99 | 0.96 | 0.77 | 1.07 | 0.59 | 1.03 | 0.44 | 0.99 |
| 5 | 1.37 | 1.09 | 1.09 | 1.03 | 1.04 | 1.00 | 0.77 | 0.95 | 0.72 | 0.92 | 0.67 | 0.87 | |
| 10 | 1.15 | 1.03 | 1.03 | 1.01 | 1.02 | 1.01 | 0.90 | 0.98 | 0.88 | 0.97 | 0.86 | 0.97 | |
| 20 | 1.02 | 1.00 | 1.00 | 1.00 | 1.00 | 1.00 | 0.98 | 1.00 | 0.98 | 1.00 | 0.98 | 1.00 | |
| 100 | 2 | 2.08 | 1.48 | 1.48 | 1.11 | 1.01 | 0.96 | 0.48 | 0.83 | 0.25 | 0.63 | 0.36 | 0.44 |
| 5 | 1.75 | 1.55 | 1.55 | 1.13 | 1.08 | 1.04 | 0.53 | 0.68 | 0.46 | 0.58 | 0.39 | 0.47 | |
| 10 | 1.42 | 1.39 | 1.39 | 1.09 | 1.04 | 1.04 | 0.73 | 0.77 | 0.70 | 0.71 | 0.67 | 0.65 | |
| 20 | 1.21 | 1.22 | 1.22 | 1.05 | 1.01 | 1.01 | 0.88 | 0.87 | 0.83 | 0.82 | 0.79 | 0.78 | |