Study of the Settlement Characteristics of the Soil Deposits at Kingsford-Smith Airport, Sydney
Summary.—The paper describes the geotechnical studies carried out to establish the origin and rate of settlement of the soil deposits at Kingsford-Smith Airport, Mascot, Sydney.
Settlements were predominantly due to compression of a highly compressible () silt-clay of low permeability. This soil occurred in layers up to 25 ft. thick.
A comparison of the theoretical settlement (based on the actual loading history) with measured settlements at times when the consolidation was only partially completed, showed excellent agreement provided the coefficient of consolidation was recorded on samples with a drainage path in excess of the drainage path of conventional samples. The typical comparative values were and , respectively.
It was considered that the post-construction settlements could be confidently predicted.
1.—INTRODUCTION
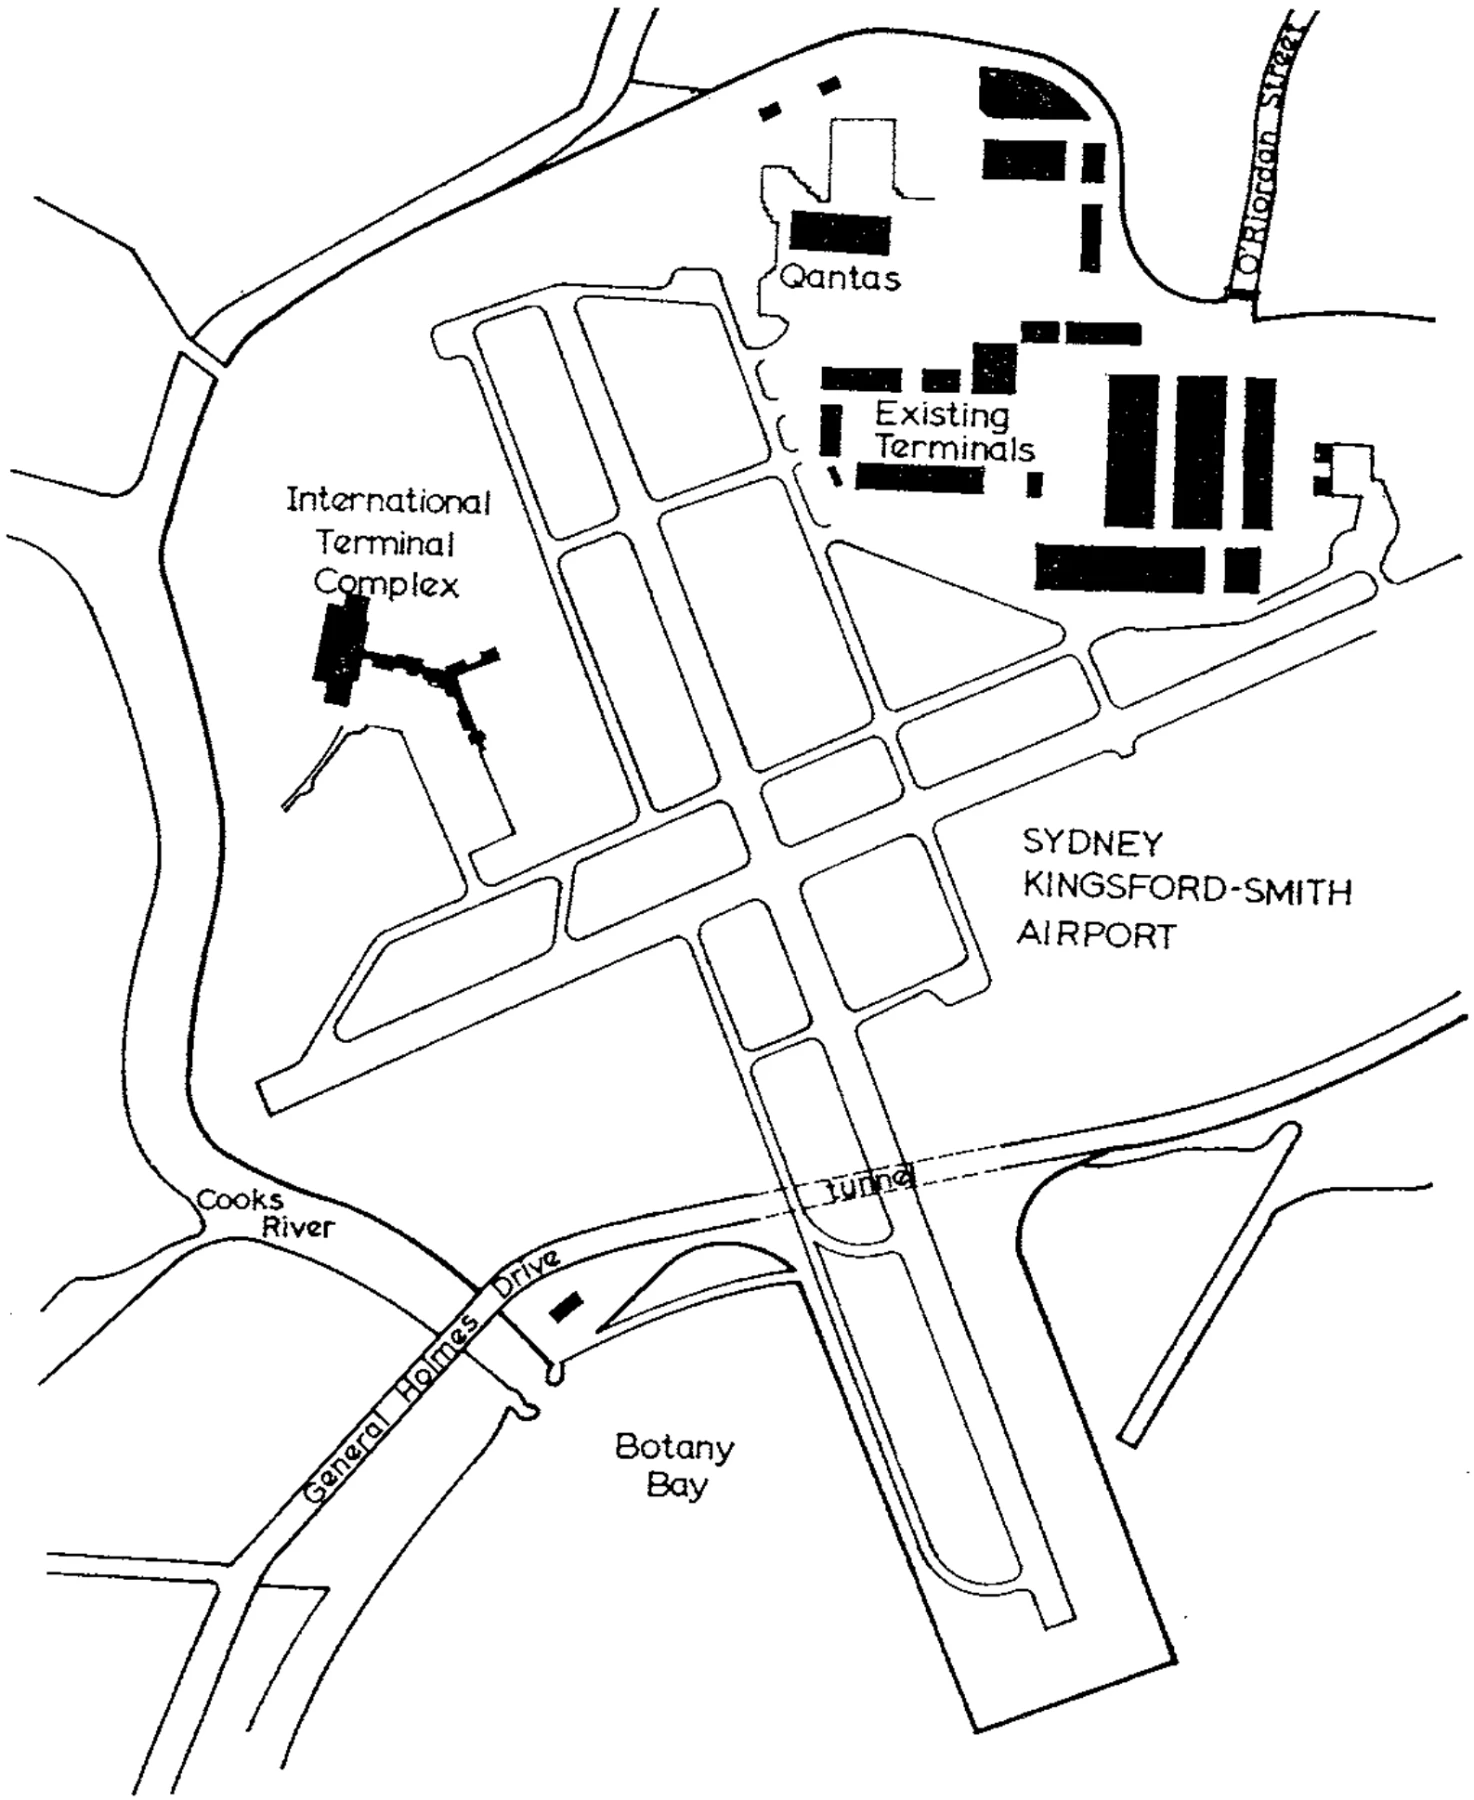
As part of the design studies of the pavements and structures in the vicinity of the New International Terminal, Kingsford-Smith Airport, Sydney, a geotechnical investigation was made of the soils in the north- western area of the airport. The primary purpose of these studies was to predict the total settlement and the rate of settlement of the soils in the period following construction of the pavements.
The north-western section of the airport was originally a shallow swamp. There was no development in this area until the late 1940’s so that prior to initial filling operations, which commenced in 1961, the land level was a few feet below sea level with a few grassed areas just above the water level. The Cooks River partially enclosed the site of the Inter- national Terminal, and there is evidence to suggest that it had meandered over the surrounding areas in Recent times.
In 1947, work commenced on new runways and filling of sections of the Cooks River was commenced. The diversion channel for the river was under construction. Fill for the operations was sand obtained by dredging of Botany Bay. The Cooks River east of the terminal had been filled by 1954 and some limited filling adjacent to the banks of the river had also been completed.
In 1961, filling of the terminal area was commenced and continued until 1964. Flyash from Bunnerong Power Station was used to fill part of the river south-east of the terminal and in the proposed car parking area. The flyash was removed from the latter area in 1966 and the whole site filled and surcharged with sand late in 1966.
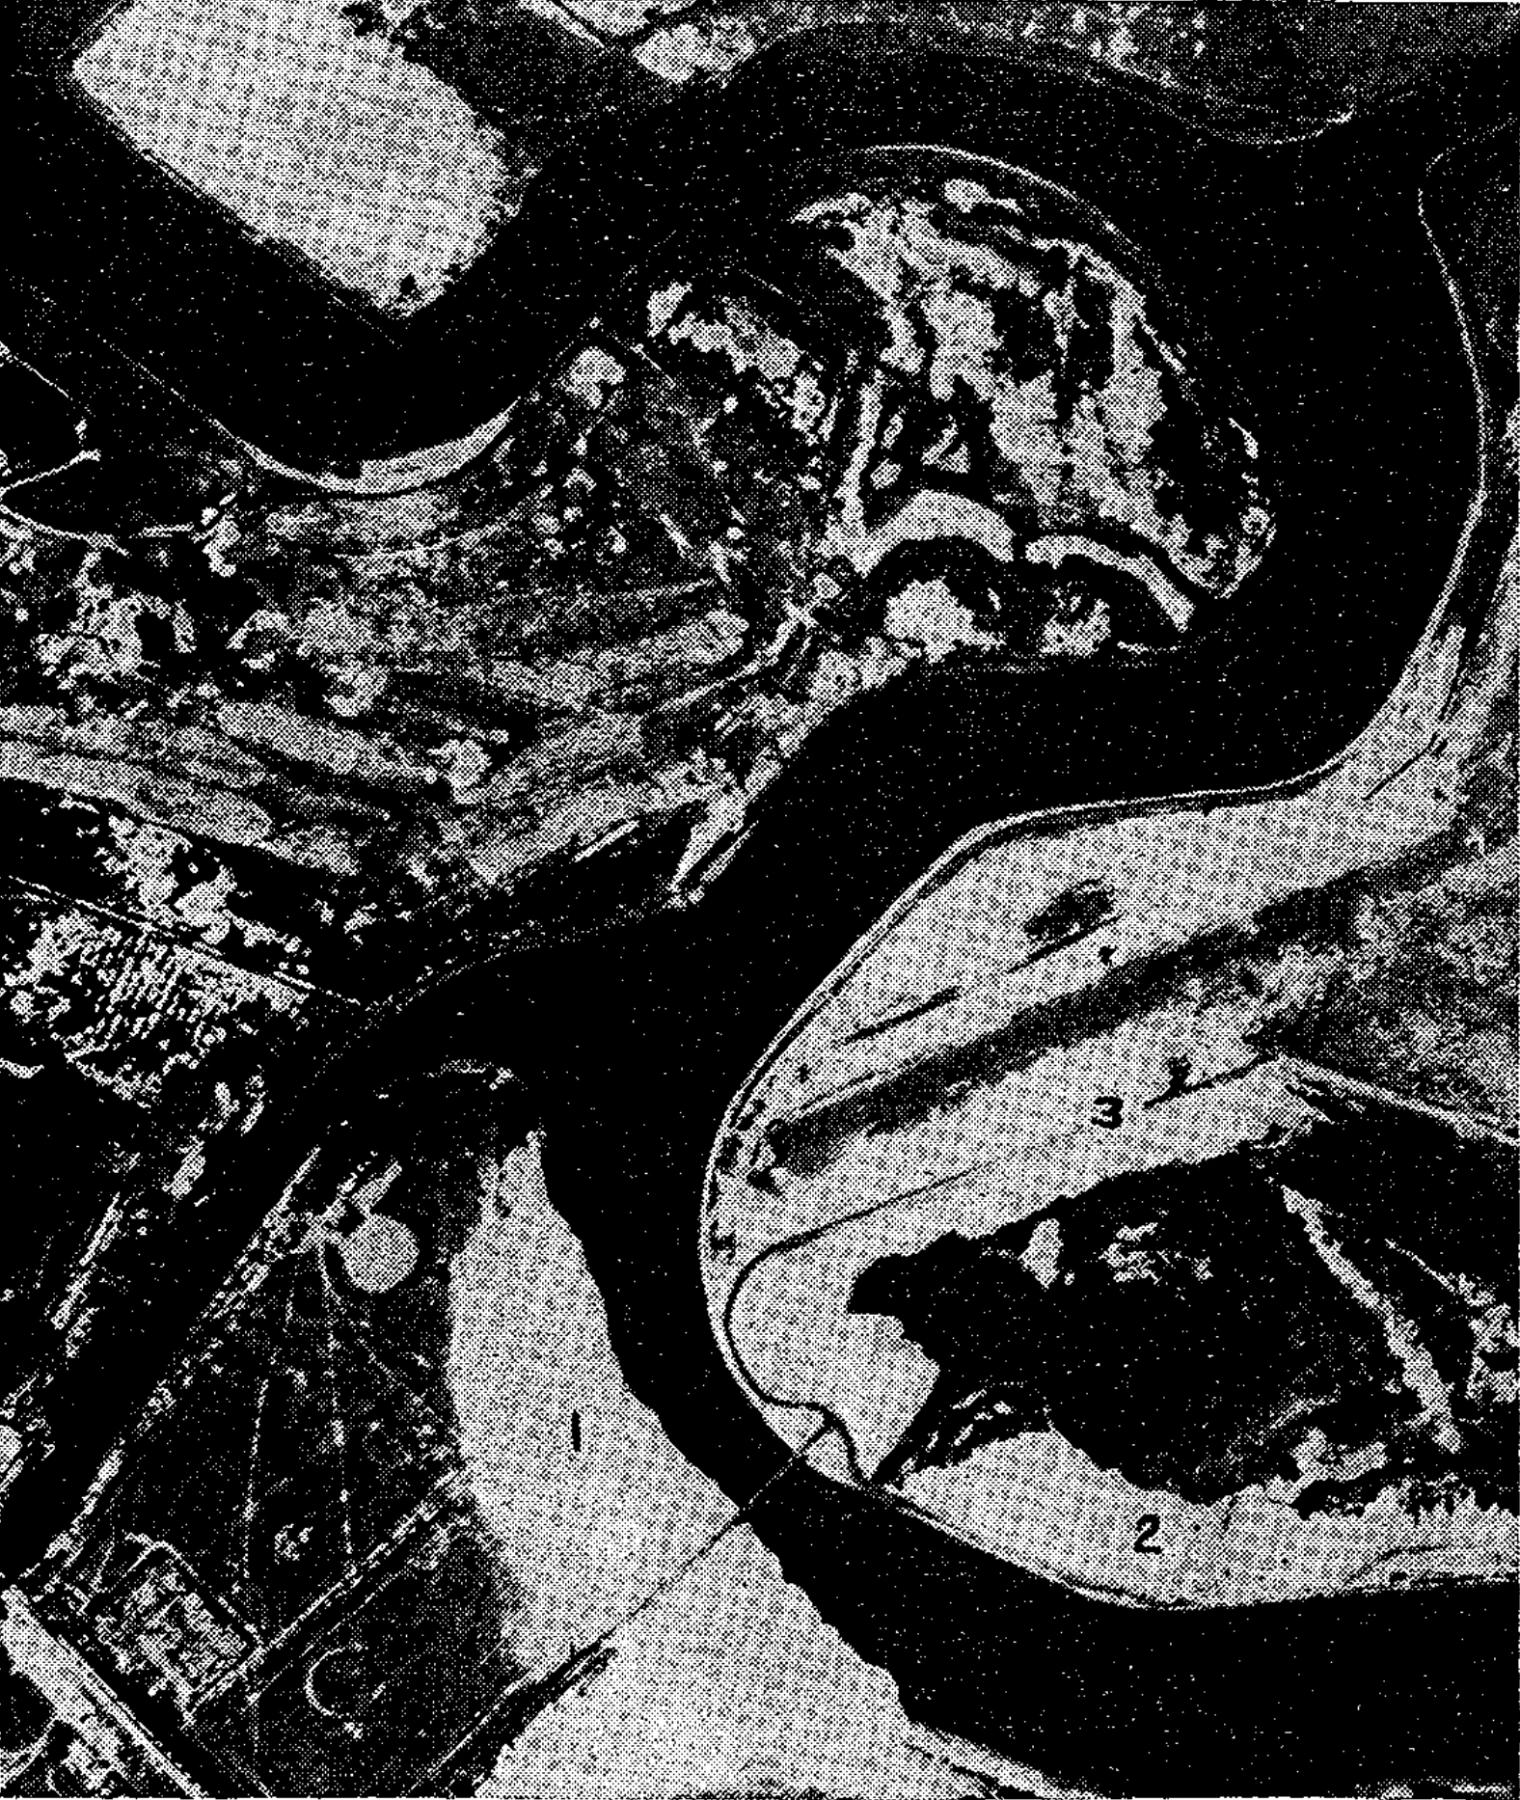
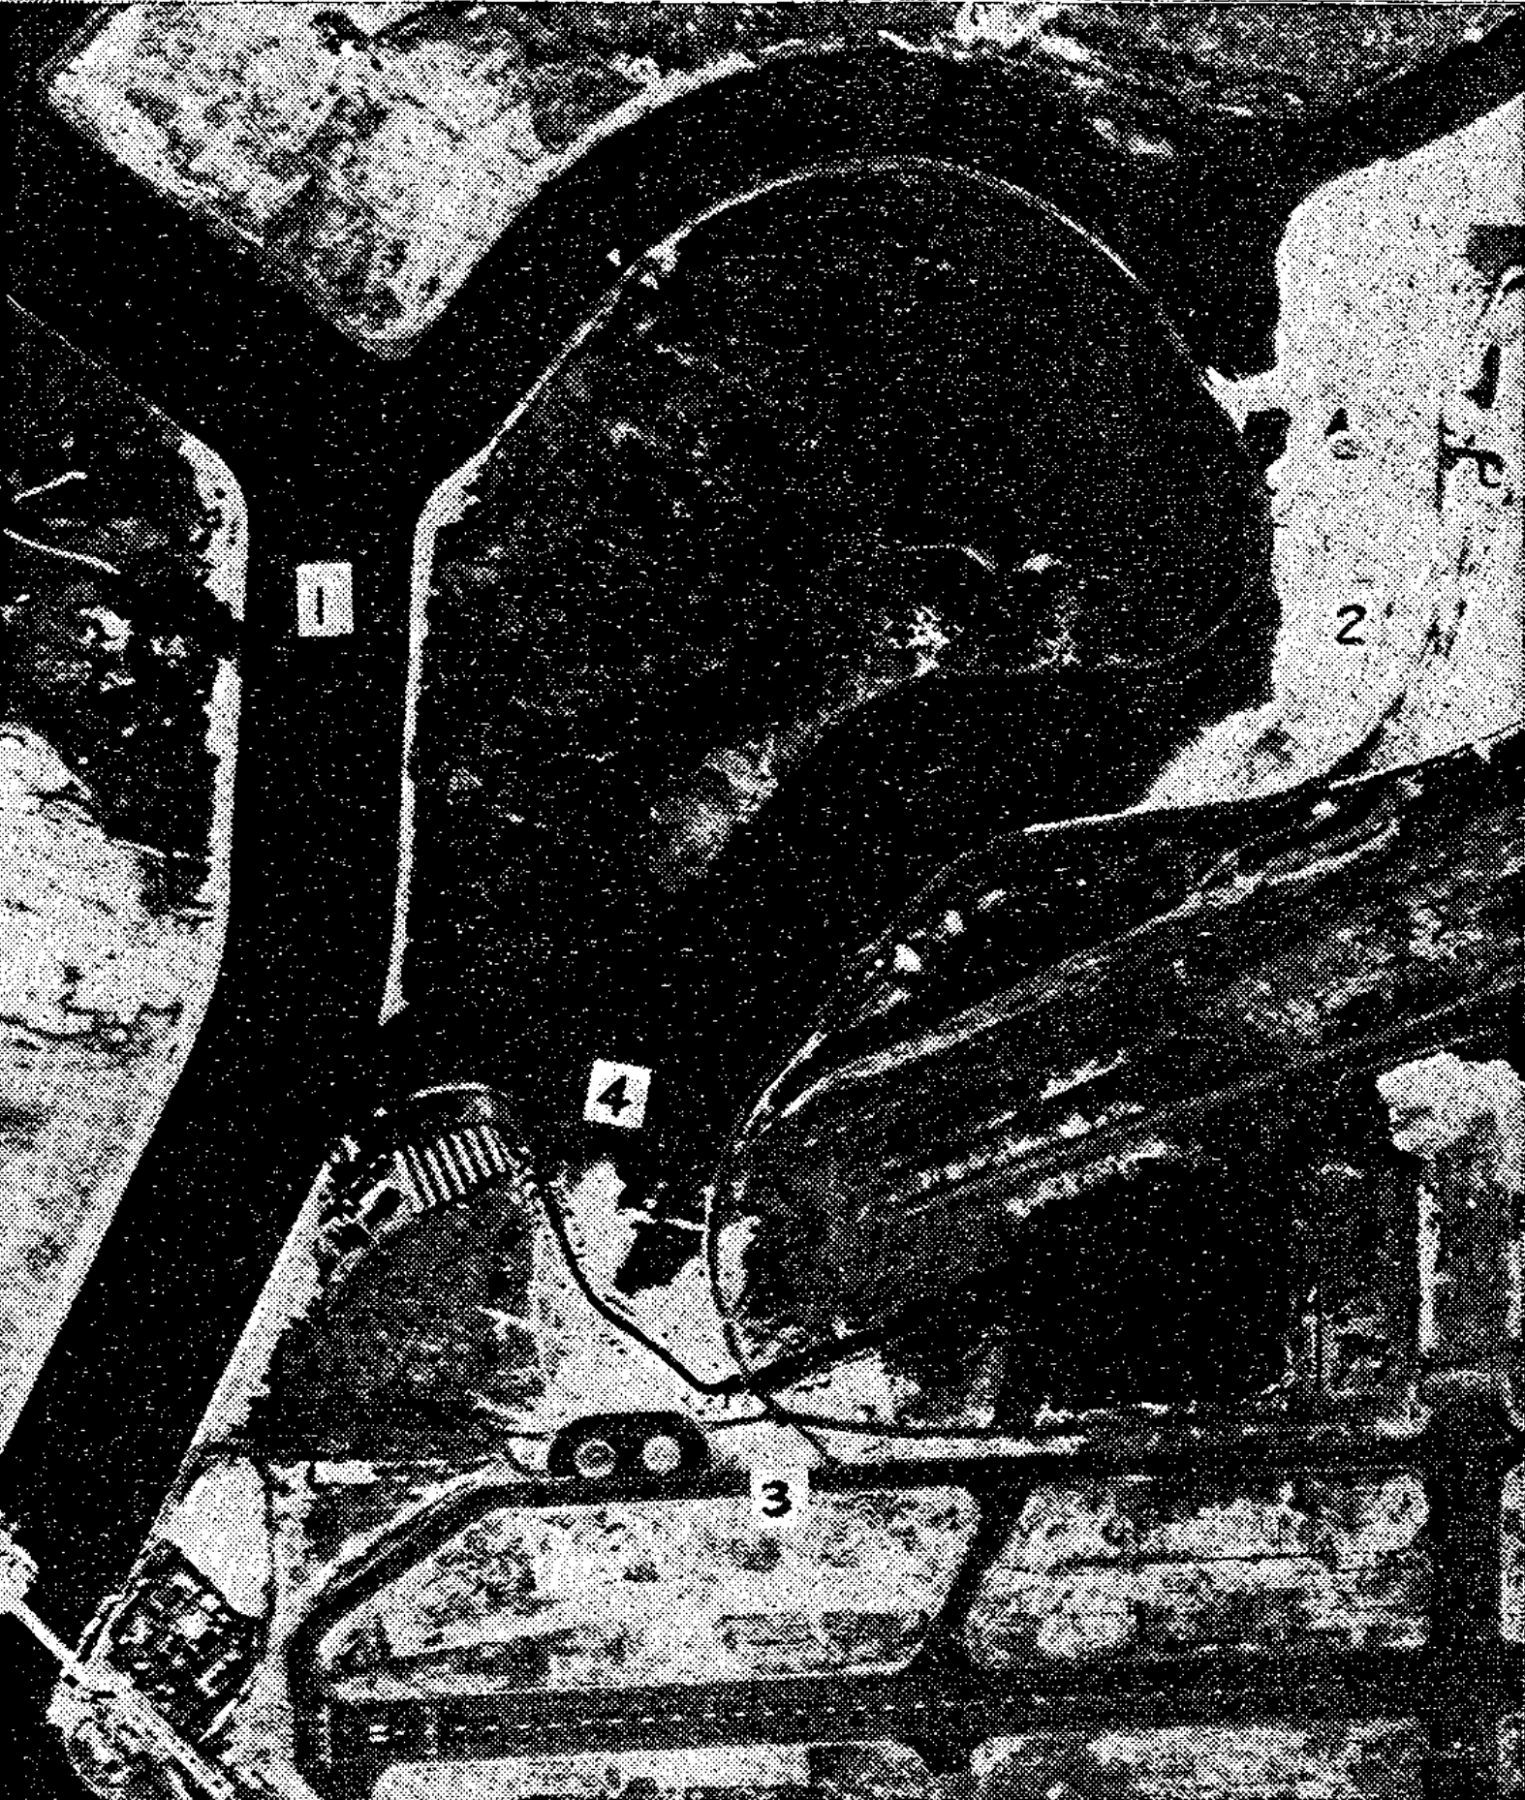
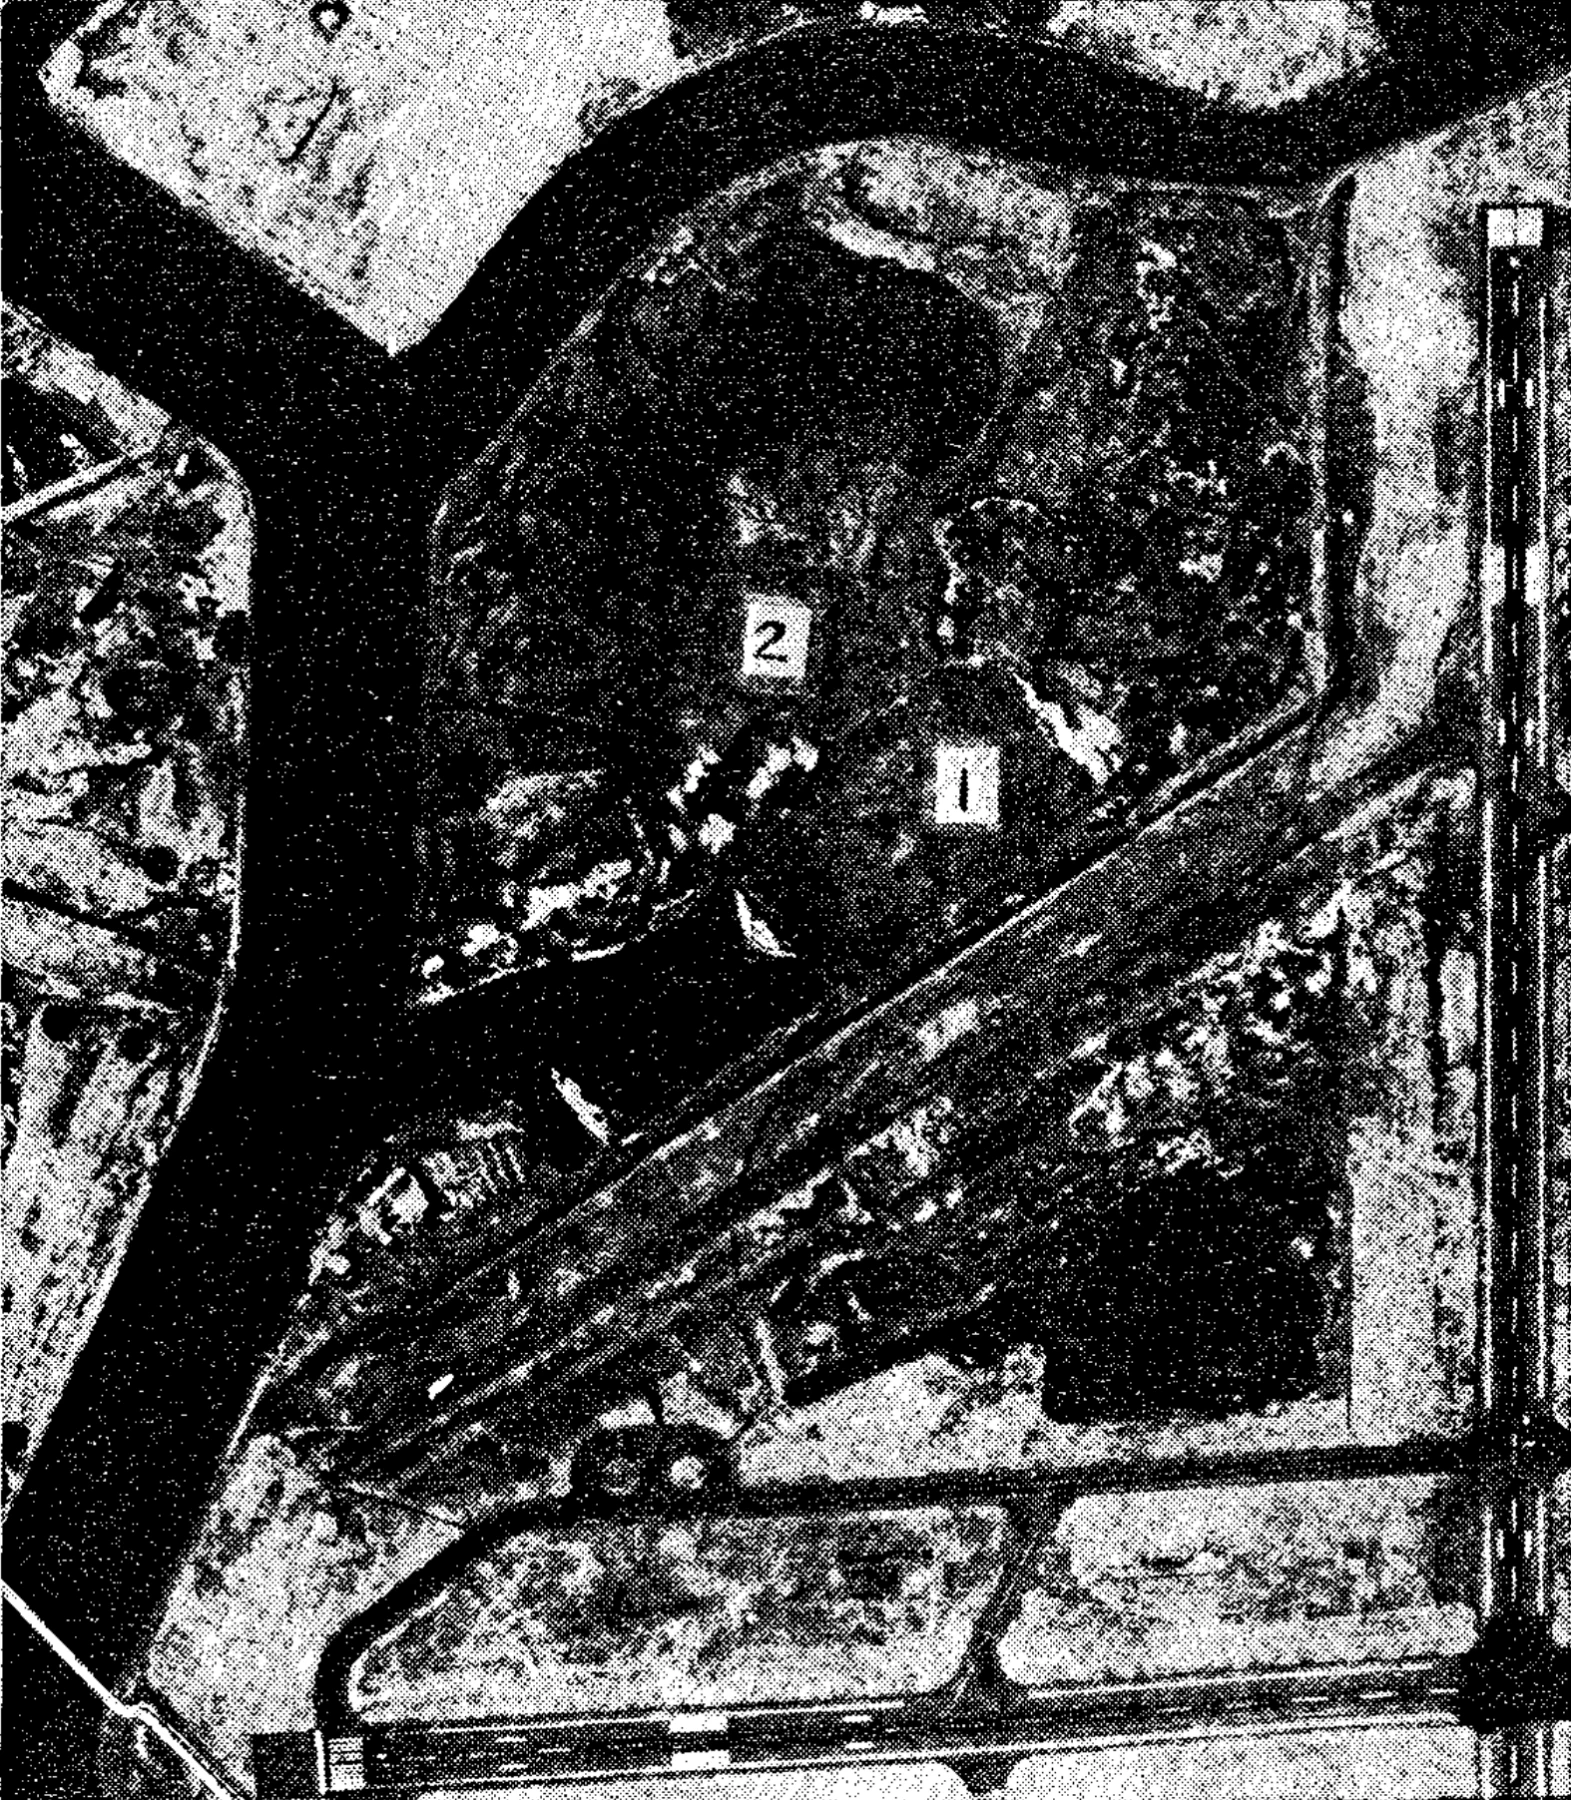
Fig. 1 shows the location of the terminal relative to the runways and existing development. Fig. 2 was taken in 1948 when filling of Cooks River had commenced, and Fig. 3 shows the progress in 1953. The diversion canal was completed (marked as (1) in the photograph), filling of the river adjacent to the north-south runway was well advanced (2), construction of the East-West runway and taxiways was completed (3) and filling of the river was partially completed in the area of the East-West runway (4). Fig. 4 was taken in 1963 when portion of the river had been filled with flyash (1), and filling of the proposed car park had commenced (2).
Investigations by the Commonwealth Department of Works had established that relatively large settlements due to filling and pavement loadings were likely, and the decision was made to surcharge the area to reduce the settlement in the post-construction period.
The fill and surcharge, which was pumped from Botany Bay had an in-situ dry density of 97-100 lb./cu. ft. The maximum dry density is 115 lb./cu. ft. (Kolbuszewski, Ref. 12). There was no mechanical compaction of the fill.
The subsequent investigations discussed in this paper were aimed at establishing the magnitude of the settlements from the time filling operations commenced in 1961 to 20-25 years after construction of the pavements were completed.
From aerial photographs and levelling data it was possible to recon- struct the loading history at selected points in the terminal area. The likely accuracy of the calculated levels of the surface was considered to be ± 6 in.
Five sites were analysed in detail. At each site the soil was continuously sampled over the full depth of the deposits thus providing a complete undisturbed profile of the soils. Piezometers were installed with the object of recording the magnitude of the excess pore water pressures at the time of the investigation (1967) and to provide data for calculating the field coefficient of consolidation. Settlements at each selected site had been recorded since filling and surcharging so that a comparison of predicted and measured settlements was possible.
2.—FIELD INVESTIGATIONS
Preliminary investigations had shown that the soil profile was extremely variable, and this fact established the need for continuous sampling over the full depth of the soil deposit. This was achieved by pushing 3-in. internal dia. by 24-in. long thin-walled sampling tubes into the soil a distance of 18 in., withdrawing the tube, pushing the casing to the level reached by the end of the sampling tube, and repeating the procedure. The usual technique was to use 8-in. dia. casing driven into the less permeable layers to a depth sufficient to seal off the hole from the more permeable layers. Six-in. dia. casing was then used to complete the hole. At all stages the water level in the bore hole was maintained a few feet above the observed water table to eliminate the possibility of severe hydraulic gradients in the soil immediately beneath the level of the casing tip. Diamond drilling was used to drill into the shale and sandstone which forms the bedrock in the area.
Sample recovery was generally extremely good, and there were no visual signs or laboratory evidence of significant sample disturbance.
At the time of the field investigations, a theoretical analysis of the rate of settlement, predicted relatively large excess pore-water pressures in the less permeable (organic silt-clay) deposits. In order to register these pressures a series of piezometers were installed. A total of 19 piezometers were located in the vicinity of the terminal. After installation of the tips the bore holes were sealed by AM9 chemical grout and bentonite.
The effectiveness of the sealing along the borehole of some of the piezometers became suspect when the readings were not consistent during installation. The reliability of the chemical grout appeared to be doubtful as the setting time varied considerably and, on some occasions, no set took place.
In an investigation to establish whether a group of piezometers installed in one borehole were functioning properly, a field test was carried out by placing 5 ft. of surcharge over a circular area 200 ft. in diameter with the piezometers centrally placed relative to the surcharge area. At this particular site there was an organic silt-clay layer 22 ft. thick. Seven piezometers had been installed in this layer. The theoretical increase in pore-water pressure in the layer due to the extra surcharge was 10 ft. of water, whereas measured values were within the range of 4 to 10.5 ft. of water.
On the basis of this test, and an overall analysis of the piezometers, it became evident that the recorded pore-water pressures were less than the actual values due to ineffective sealing along the borehole. This was unfortunate as one of the purposes of the installation was to provide a further check on the predicted rate of settlement by calculating the field value of the coefficient of consolidation from the finite difference form of the one-dimensional consolidation equation and measured pore-water pressures over a period of 6 to 12 months.
However, there were two major conclusions which were drawn from the piezometer data:-
- There were large excess pore-water pressures in the organic silt-clay deposits in the northern area of the terminal site.
- The sand layers which occurred between the relatively impermeable clay deposits were of sufficient extent and adequate permeability to be regarded as drainage layers.
The water level observed in open boreholes in the terminal area was RL 7.0 ft., whereas the water level in the bedrock was at sea level. A perched water table was initially developed during the hydraulic filling, and it was evident that some excess water pressure still remained at the time of the investigation due to the slow rate of flow through the underlying silt and clay layers.
- Work has commenced on the filling in of Cooks River.
- Filling has also commenced on the filling in of the ponding area.
- More sand fill is being placed adjacent to the old runway.
- Diversion Channel of Cooks River completed.
- Filling of old river adjacent to North-South runway well under way.
- Construction of East-West runway and taxiways completed.
- Filling of old river almost complete in area of East-West runway.
- Portion of old river filled with flyash.
- Flyash spreading out over car parking area for new terminal.
3.—GEOTECHNICAL PROPERTIES OF SOIL DEPOSITS
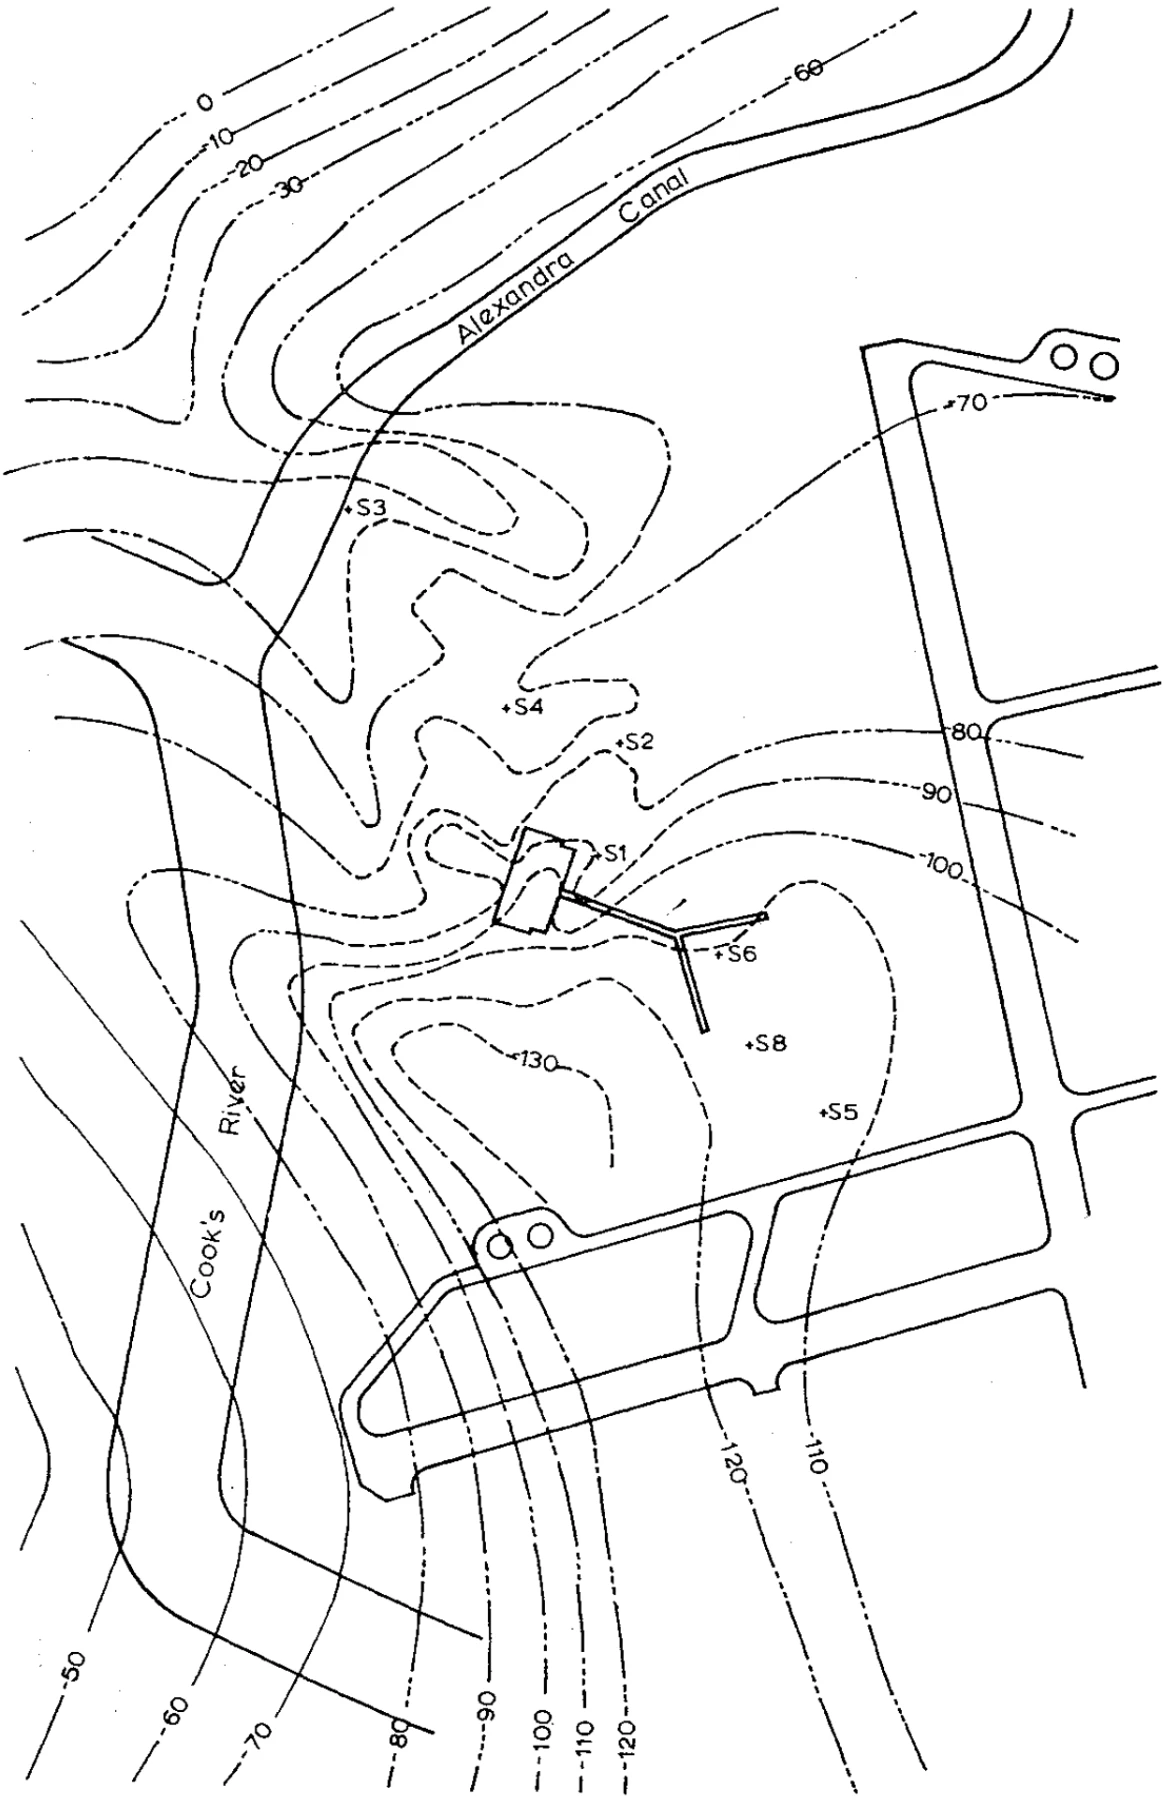
The soil profile in the airport area is quite typical of many of the deposits in bay areas near Sydney. It is also very similar to other deposits in coastal regions (Roberts and Darragh, Ref. 8). There is generally a layer or lens of a highly compressible organic silt-clay of a total thickness varying up to 25 ft. Beneath this layer there are commonly variable sand or sandy clay layers of limited thickness overlying a relatively stiff inorganic clay. The bedrock in the area is the Sydney sandstone. The total depth of soils is generally of the order of 80 to 120 ft. Fig. 5 shows contours of the rock surface. It will be noted that the course of Cooks River was not controlled by the profile of the bedrock surface.
The origin of the stiff inorganic clay is unknown although there is the probability that it is the result of the degradation of shale. The shale occurs in isolated areas immediately overlying the bedrock. There are fine well defined bedding planes in some sections of the clay but these are not consistent throughout the deposit. The clay is generally light grey in colour in the fresh state.
In some areas there are two distinct layers of the inorganic clay with a sand layer between the clay layers. Such a sand layer was found to vary in thickness from a few inches to 13 ft. and piezometric measurements established that it was of sufficient lateral extent to be regarded as a drainage layer. The in-situ bulk density was 130 lb./cu. ft. with S.P.T. values of 10 to 30.
The upper inorganic clay layer, when it was present, had engineering properties essentially identical with the lower inorganic clay layer. Typical properties are given In Table I.
From the point of view of long term settlement, the highly compressible, relatively impermeable organic silt-clays were of greatest significance. This clay is a normally consolidated deposit up to 25 ft. thick occurring in lenses of large lateral extent. There is some evidence to show that some of the deposition occurred during the meandering of Cooks River. Some deep local lenses appear to be the result of mud slides into holes made by dredging of Cooks River.
| Property | Value |
|---|---|
| Water Content | |
| Bulk Density | |
| Liquid Limit | |
| Plasticity Index | |
| Undrained Shear Strength | |
| Compression Index (compression) | |
| Compression Index (rebound) | |
| Vertical Coefficient of Consolidation (oedometer) |
There are numerous fibrous plant roots throughout the deposit at spacings varying from 0.1 in. to several inches. Shells, typically to inches in size, are frequent in layers but are not uniformly dispersed over the whole deposit. Samples for oedometer testing using the conventional 3-in. and 1.35 in. dia. rings were necessarily taken from zones free of large shells and roots and are thus more representative of the more impermeable layers, and as shown in this paper do not give a good measure of the field value of the coefficient of consolidation of the whole deposit. Such samples are referred to as “clear” samples.
The deposit is anisotropic with respect to permeability. Values of vertical permeability were found to be as low as 10-6 ft./min. The horizontal permeability appears to be an order higher than this although still very low by comparison with many clay soils. The ratio of horizontal to vertical coefficient of consolidation . recorded in a test (Ref. 5) was twelve to one. Similarly, comparative oedometer tests on samples normally prepared, and prepared by cutting a sample so that the load was applied in the direction of the layers instead of normal to the layer direction (termed a pseudo-radial consolidation test), showed an anisotropy with respect to values of compression index and coefficient of consolidation. It should be recognized, however, that the pseudo-radial consolidation test does not give the value of directly but gives a coefficient of consolidation associated with compression in the direction of layers say, . To establish the value of from such tests it would be necessary to correct for the anisotropy of the coefficient of volume decrease. Thus if is the coefficient of volume decrease with the consolidation pressure applied in a direction at right angles to the bedding planes, and is the coefficient of volume decrease with the consolidation pressure applied in the direction of the bedding planes, then
In the present investigation was measured in the test, but the radial oedometer (Ref. 10) would be also eminently suitable. The latter has the advantage that large diameter samples can be tested.
The anisotropy is reflected on a macro-scale by layering and laminations. The degree and type of layering is extremely variable and often cannot be observed unless the soil samples are broken open and observed continually as the soil dries out (Ref. 9).
The organic silt-clay is readily distinguishable from the other soils in the area provided undisturbed samples are examined. The characteristic features are the dark colour, occasional presence of shells and fibrous roots, the slight organic odour, obviously low strength, and virtual loss of strength on remoulding. More specifically, typical properties in the terminal area are listed in Table II.
The oedometer results for the organic silt-clay were found to be consistent from borehole to borehole provided the soil was systematically identified. It was found that there were regions north of the terminal area where the compression index of the organic silty clay varied between 1 and 2 with a typical value of 1.5. Values of c. were similar to those listed in Table II, although there was a greater scatter in measured values.
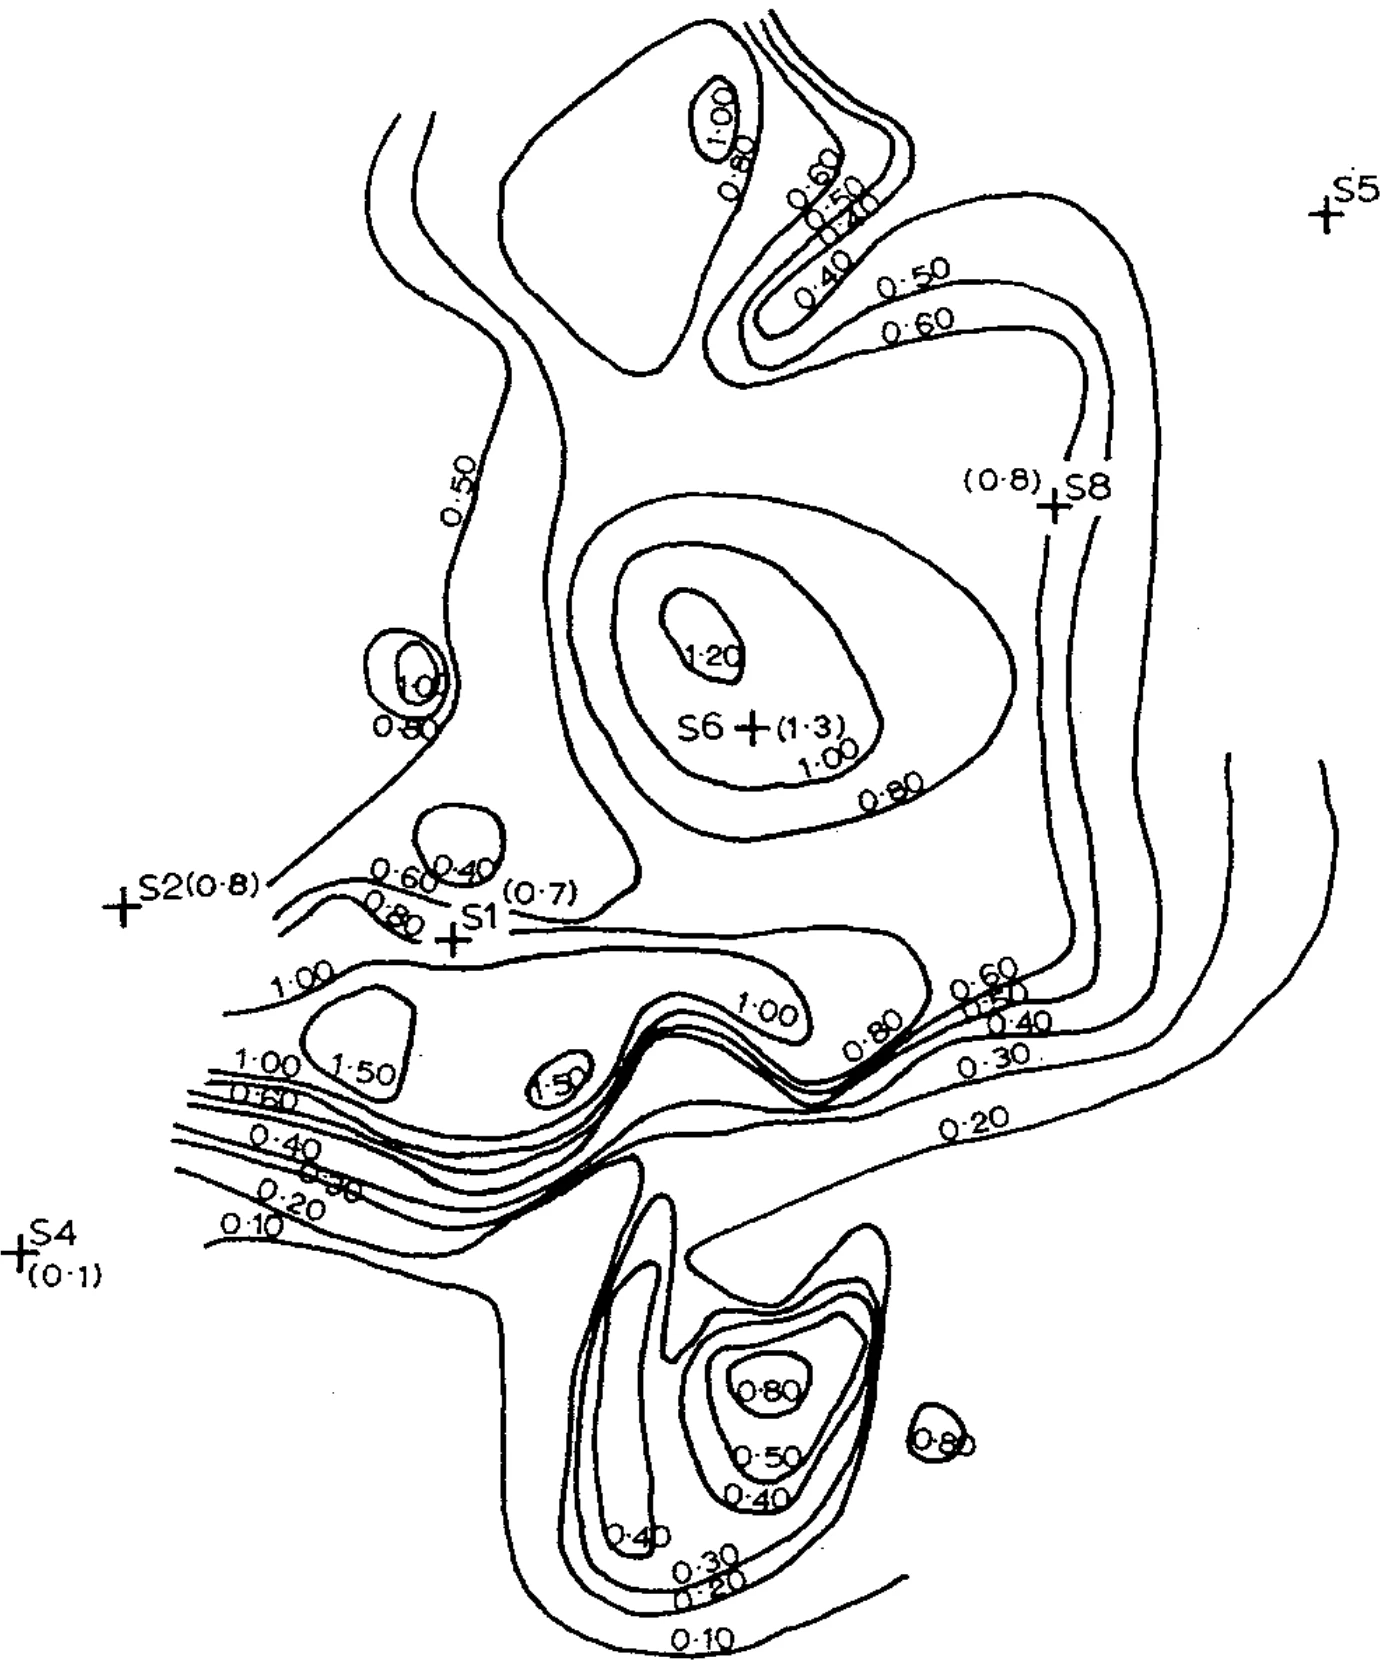
Fig. 6 shows contours of equal thickness of the organic silt-clay in the vicinity of the terminal.
Acceleration of the rate of settlement of this type of soil can be effected by electro-osmosis (Ref. 2) provided the voltage gradient required to produce a practical discharge does not involve excessive current. A saline environment of the type at Mascot increases the conductivity of the soil-water combination compared with a fresh water environment and the process finally proved to be rather uneconomical for this reason.
| Property | Value |
|---|---|
| Organic Content | |
| Water Content | |
| Bulk Density | |
| Liquid Limit | |
| Plastic Index | |
| Linear Shrinkage | |
| Clay Fraction | |
| Activity | |
| Undrained Shear Strength | |
| Compression Index (compression) | |
| Compression Index (rebound) | |
| Vertical Coefficient Consolidation (oedometer) | |
| Vertical Coefficient Consolidation ( test) |
Values of the coefficient of osmotic permeability were found from laboratory tests to be volt using the soil water from the site. For voltage gradients up to 0.6 volts/cm. there was an essentially linear relationship between discharge and voltage gradient, but the value of was slightly dependent on voltage gradient in excess of this range and was therefore not a unique constant as originally suggested by Casagrande (Ref. 3). The specific soil resistance was 80 to 140 ohm-cm. which can be compared with 4,000-5,000 ohm-cm. in a distilled water environment.
One particular aspect of laboratory investigations into the electro-osmotic properties worthy of further consideration involves a scale effect. In the usual test the assumption is made that the voltage gradient is uniform over the length of the sample, whereas measurements have indicated that there is a sharp gradient in the region of the anode. This is illustrated in Fig. 7 which shows the voltage distribution along the length of a sample immediately the electro-osmotic process was commenced. It is evident that the average gradient differs quite significantly from the local gradient so that the size of the sample will influence the recorded value of and the discharge-time relationships.
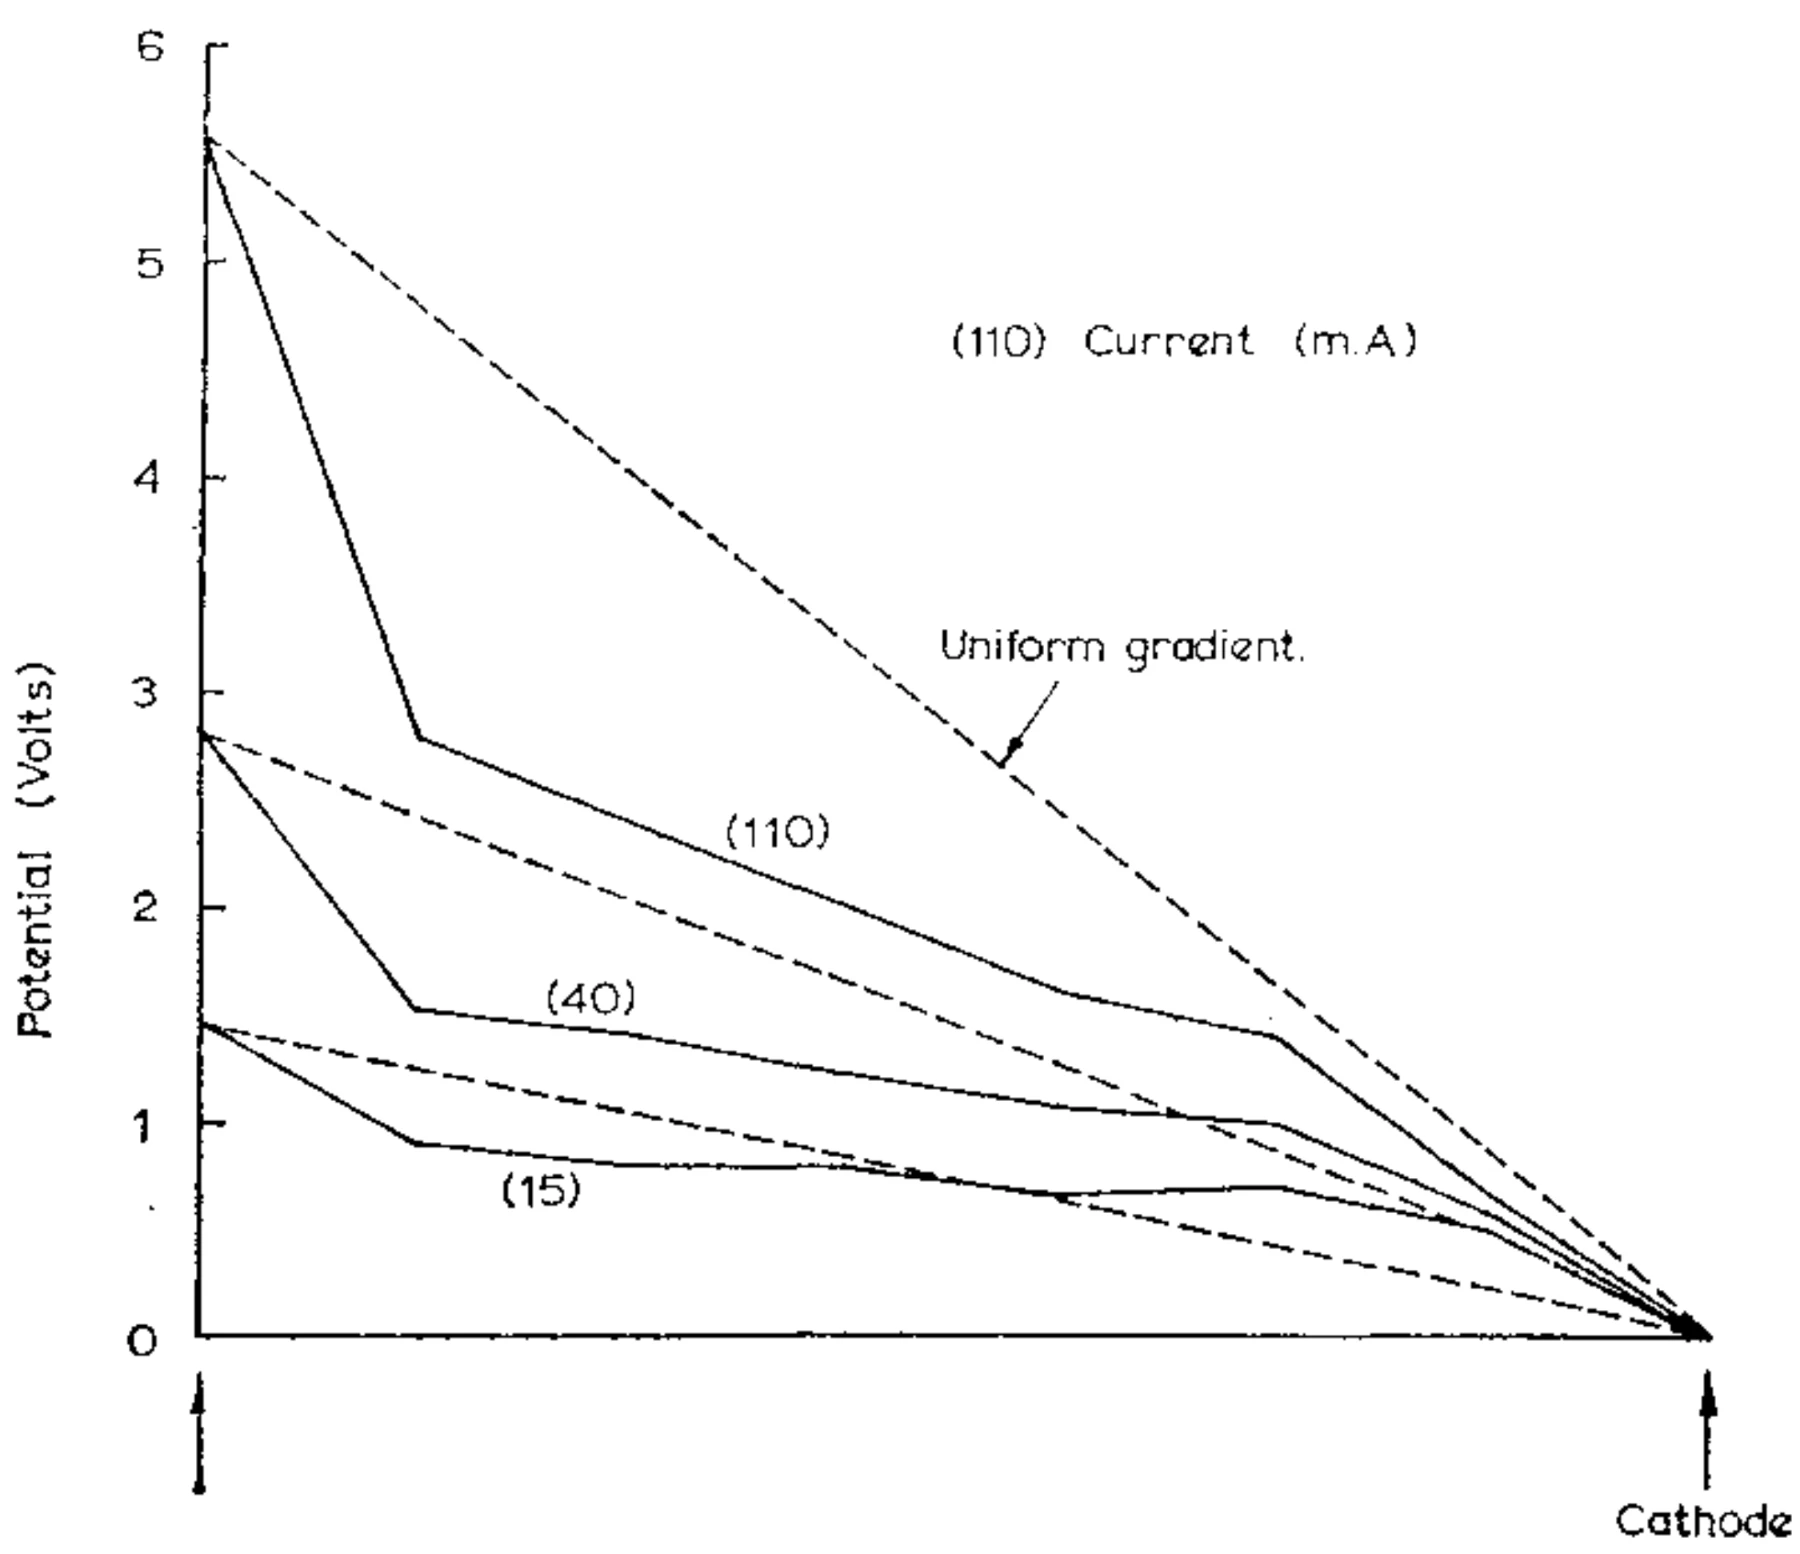
It has been observed that there is a severe drying out of the soil in the immediate vicinity of the anode. This would appear to be due to the relatively large potential gradient in this region. The non-uniform potential gradient may also prove to be the reason for the difference between the conclusion made by Casagrande regarding the constancy of and the observations made in the present investigations and by Bjerrum (Ref. 2) that was dependent on the voltage gradient.
4.—SETTLEMENTS IN THE INTERNATIONAL TERMINAL AREA
4.1 Nature of the Settlements:
From a knowledge of the loading history, the soil profile and the consolidation properties of the individual soil layers it was possible to predict by a finite-difference approach the settlement contributed by each soil layer from the time initial filling commenced in 1961.
The calculations were based on the assumption that the soils were completely consolidated under the overburden existing prior to initial filling. This appeared to be a reasonable assumption in view of the history of the area. The assumption of a one-dimensional strain state was considered to be justified in view of the fact that the lateral extent of the filling was large compared with the total depth of the consolidating layers. This is, however, a poor approximation in the areas where there was a change in surcharge level and the general conclusions do not apply to such areas.
It was not necessary to take non-linear effects into account (Ref. 6) as the typical loading increment ratio did not lead to predicted values which differed from the traditional Terzaghi analysis by more than 5%. Similarly, the anisotropic nature of the deposit was of little importance in the one-dimensional calculations, and only became significant in the prediction of settlement due to isolated loadings such as that due to aircraft parking.
Detailed settlement calculations were made for five sites taking into account the loading history of each site and the properties of the individual layers.
It was evident that the smaller value of for the organic silt-clay obtained by testing samples in the oedometer free of roots and shells represented the settlement properties of the least permeable layers within the organic silt-clay deposit. The fact that the longer samples in the test (3 in. compared with oedometer thickness of ) showed a value three times the oedometer value (see Table II) suggested that the inclusions had a significant effect on the rate of settlement, and that the value measured using the longer sample, with inclusions, was more representative of the field value. A comparison of measured and predicted settlement rates showed that this was the case and the results of the comparison can now be discussed in more detail.
Fig. 8 shows the profile and loading history of one of the typical sites (designated S1) where the organic silt-clay was 23 ft. 6 in. thick. After filling and surcharging the organic silt-clay was overlain by 33 ft. 6 in. of sand. The inorganic clay occurred as a thin deposit 5 ft. below the organic silt-clay and as a 17 ft. thick deposit at a lower level. There was a thin layer of weathered shale overlying the sandstone.
For the purposes of calculation it was assumed that surcharge was removed and pavements constructed in mid-1968. These calculations showed that the total settlement at any time can be considered to be composed of the very long term settlements due to consolidation of the organic silt-clay, the relatively rapid settlement of the deep inorganic clay layers and the very rapid settlement of sand, sandy clay, and thin clay layers.
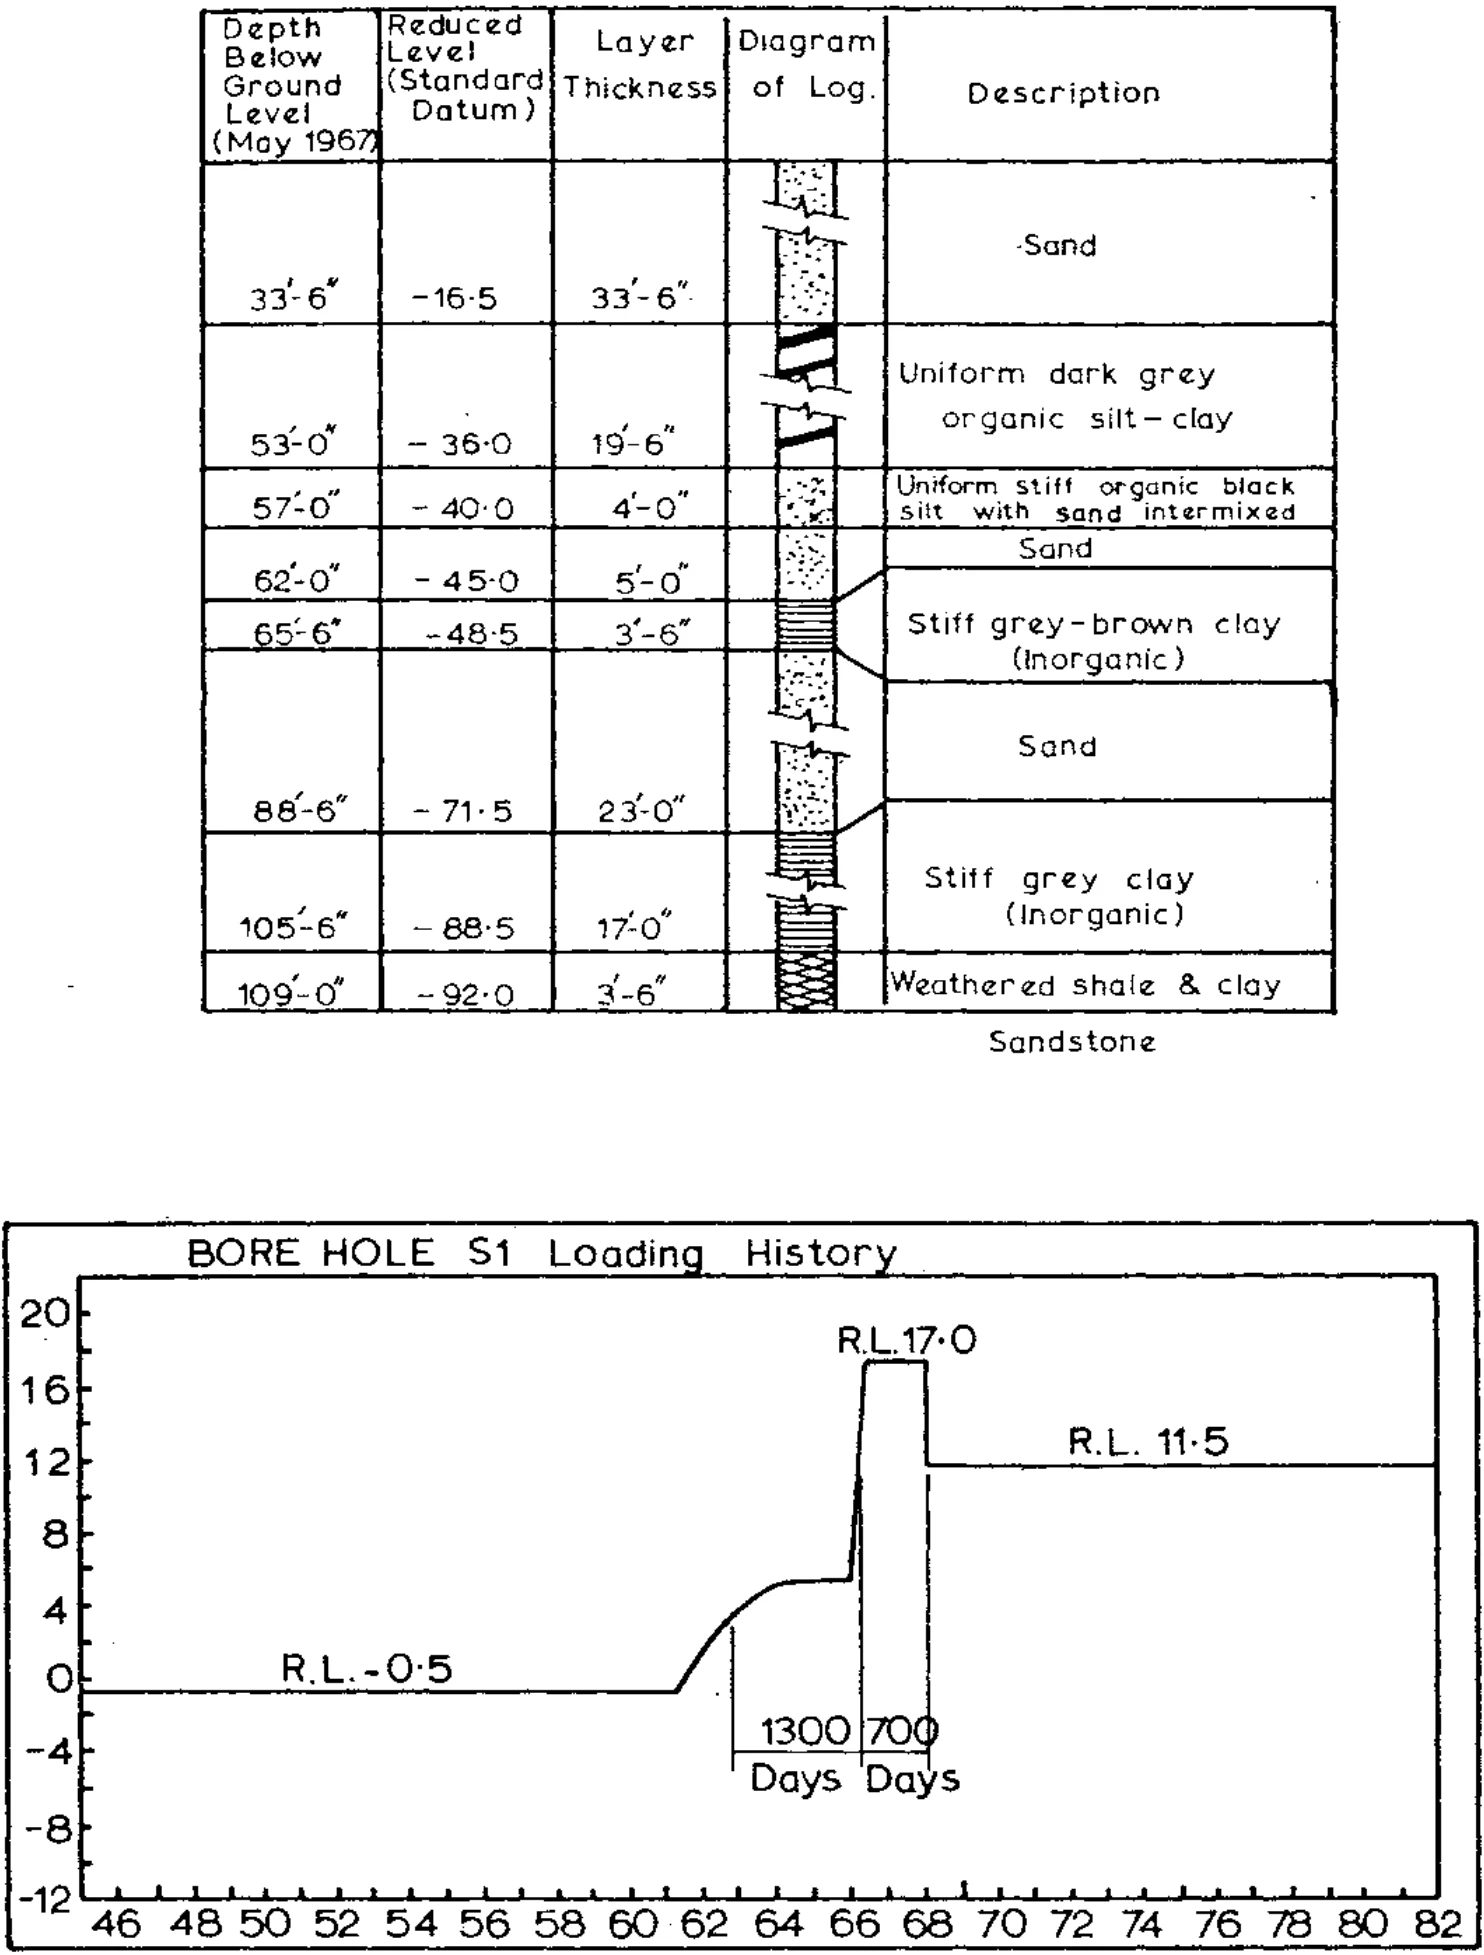
By mid-1968 the settlement of the organic silt-clay was, theoretically, 35% complete. The calculated consolidation settlement during the surcharge period was 1.03 ft., 0.84 ft. being due to compression of the organic silt-clay layer and 0.19 ft. due to compression of the other layers. Furthermore, the surcharging had resulted in very rapid consolidation of the latter layers thus eliminating post-construction settlements due to compression of such layers.
The nature of the settlements in areas where there was a thin deposit of the organic silt-clay may be contrasted with an area typified by S1. At a site designated as S8 the organic silt-clay was only 4 ft. 6 in. thick whereas the stiff inorganic clay was a continuous deposit 41 ft. 6 in. thick. Only 47% of the total final settlement of the inorganic clay was completed in the surcharge period. However, the magnitude of the total final settlement is an order less than that in the areas typified by S1.
A comparison of predicted and measured settlements from the commencement of filling to the dates listed is shown in Table III for the five sites.
| Area | May, 1967 | Aug., 1967 | May, 1968 | Total Final Settlement if Surcharge Remained | |||
|---|---|---|---|---|---|---|---|
| S1 | 0.57 | 0.70 | 0.65 | 0.80 | 0.80 | – | 1.7 |
| S2 | 0.75 | 0.60 | 0.82 | – | 1.03 | – | 2.0 |
| S4 | 0.20 | 0.30 | 0.25 | – | 0.29 | – | 0.5 |
| S6 | 1.12 | 0.80 | 1.27 | 1.10 | 1.46 | – | 1.8 |
| S8 | 0.72 | 0.55 | 0.76 | 0.60 | 0.84 | – | 0.9 |
| Area | May, 1967 | Aug., 1967 | May, 1968 | Total Final Settlement if Surcharge Remained | |||
|---|---|---|---|---|---|---|---|
| Pred. | Meas. | Pred. | Meas. | Pred. | Meas. | ||
| S1 | 0.57 | 0.70 | 0.65 | 0.80 | 0.80 | – | 1.7 |
| S2 | 0.75 | 0.60 | 0.82 | – | 1.03 | – | 2.0 |
| S4 | 0.20 | 0.30 | 0.25 | – | 0.29 | – | 0.5 |
| S6 | 1.12 | 0.80 | 1.27 | 1.10 | 1.46 | – | 1.8 |
| S8 | 0.72 | 0.55 | 0.76 | 0.60 | 0.84 | – | 0.9 |
Comparison of Predicted and Measnred Settlements (ft.)
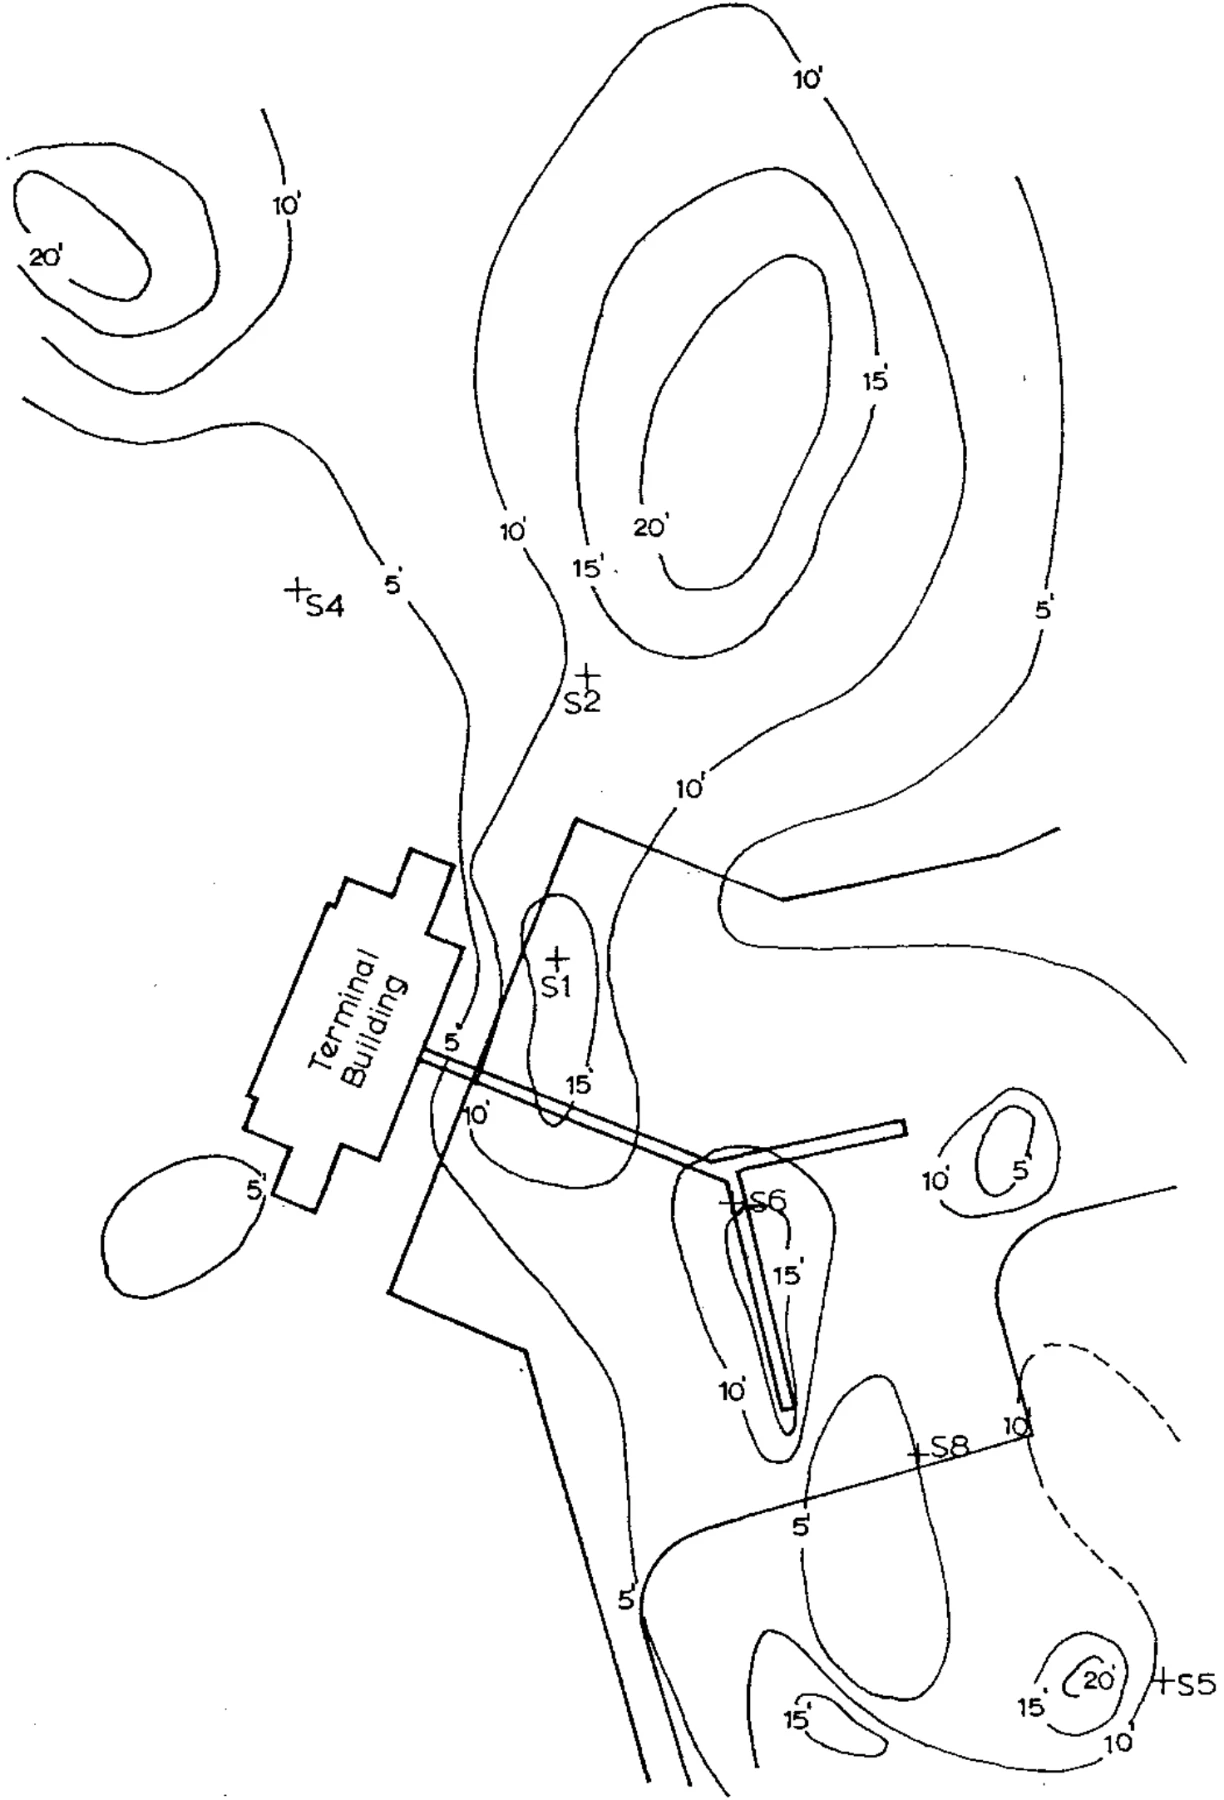
The predicted values were based on the values obtained in the test and showed that these values were more representative than the smaller values of the conventional oedometer tests. Fig. 9 shows the measured settlement contours with the calculated values superimposed.
Up to the proposed time of surcharge removal (May, 1968) the consolidation was only partially completed, so that a comparison of predicted and measured settlements is a severe test on both the total settlement and rate calculations. For the purpose of establishing the degree of consolidation, the total final settlement is quoted in Table III as if the surcharge was maintained for infinite time. The theoretical degree of consolidation at May, 1967, varied between 34% (S1) and 80% (S8).
The agreement between predicted and measured values was considered to be consistent evidence of the validity of the settlement analysis, and justified the extension of the analysis to the prediction of settlements in the post-construction period, that is, in the period subsequent to surcharge removal and construction of the pavement.
4.2 Post-Construction Settlements:
The general effect of surcharging where there was a substantial deposit of the organic silt-clay, was to eliminate post-construction settlements due to compression of layers other than the organic silt-clay layer.
If pavement construction had proceeded immediately after filling, the typical long-term settlement in an area where the organic silt-clay layer was 10 to 15 ft. thick was calculated to be of the order of 18 in. This value can be compared with the post-construction settlements quoted in Tables IV and V which apply to construction of the pavement preceded by two years of filling and surcharging.
| Time after Pavement Construction | Filled Only (5 ft. Fill) | Filled Plus 6 ft. Surcharge | Filled Plus 10 ft. Surcharge* |
|---|---|---|---|
| 2 years | 0.12 | 0.01 | -0.02 |
| 5 years | 0.17 | 0.01 | -0.03 |
| 10 years | 0.18 | 0.01 | -0.05 |
| Total Final Settlement | 0.18 | 0.01 | -0.03 |
Calculated Post-Construction Settlements (ft.) (10 ft. of Organic Silt-Clay)
*Negative sign means a heave.
Filling alone to the final construction level leads to the post-construction settlements being restricted to compression of the organic silt-clay. The long-term post-construction settlement contributed by 10 to 15 ft. of organic silt-clay was of the order of 3 to 7 in. Surcharging to a height of 6 ft. above final construction level decreased the long-term post-construction settlement to the range 1 to 6 in., that is, the general effect of the surcharge was a further settlement reduction of 2 in.
The calculations predict that if the pavement had been constructed immediately after filling (no surcharge) the predicted consolidation settlement would have been 12 in., ten years later. In contrast the calculations predict 3 to 5 in. if pavement construction was delayed 2 years and 1 to 4 in. if, in addition, the area was surcharged for these two years.
The calculations also established that there was no significant reduction in post-construction settlements by maintaining the fill and surcharge for a period in excess of 18 months to 2 years, so that it was not necessary to delay construction of pavements in areas filled in 1966.
| Time after Pavement Construction | Filled Only (5 ft. Fill) | Filled Plus 6 ft. Surcharge | Filled Plus 10 ft. Surcharge* |
|---|---|---|---|
| 2 years | 0.21 | 0.15 | 0.16 |
| 5 years | 0.42 | 0.32 | 0.25 |
| 10 years | 0.61 | 0.44 | 0.34 |
| Total Final Settlement | 0.82 | 0.56 | 0.44 |
Calculated Post-Construction Settlements (ft.) (20 ft. of Organic Silt-Clay)
A further important conclusion is that the reduction in post-construction settlement by increasing the height of surcharge from 6 to say, 10 ft., is relatively small. For example, referring to Table V the decrease in settlement for 10 years following construction is seen to be 0.10 ft. In areas where post-construction settlements are primarily due to compression of the deep seated clay layers surcharging has little practical effect due to the reduced order of magnitude of these settlements compared with areas of thick layers of the organic silty clay.
From the preceding discussion it is evident that large long term settlements in previously surcharged areas will be primarily due to compression of the organic silt-clay layer. Thus the future settlements of pavement areas can generally be satisfactorily predicted by a consideration of the organic silt-clay layers alone, and making a small allowance for compression of other layers where the thickness of the organic silt-clay is less than, say, 10 ft. From the layer thickness, either from Fig. 6 or in-situ drilling, and using a coefficient of consolidation of and a compression index of 1.0, the post-construction settlements can be predicted with sufficient accuracy for most purposes. This does, however, necessitate a consideration of the loading history from commencement of filling (1966) and usually the use of a finite-difference technique to provide a sufficiently flexible analysis for any particular loading history. Such an analysis led to the post-construction settlements quoted in Tables IV and V. This approach will be termed the “simplified analysis”.
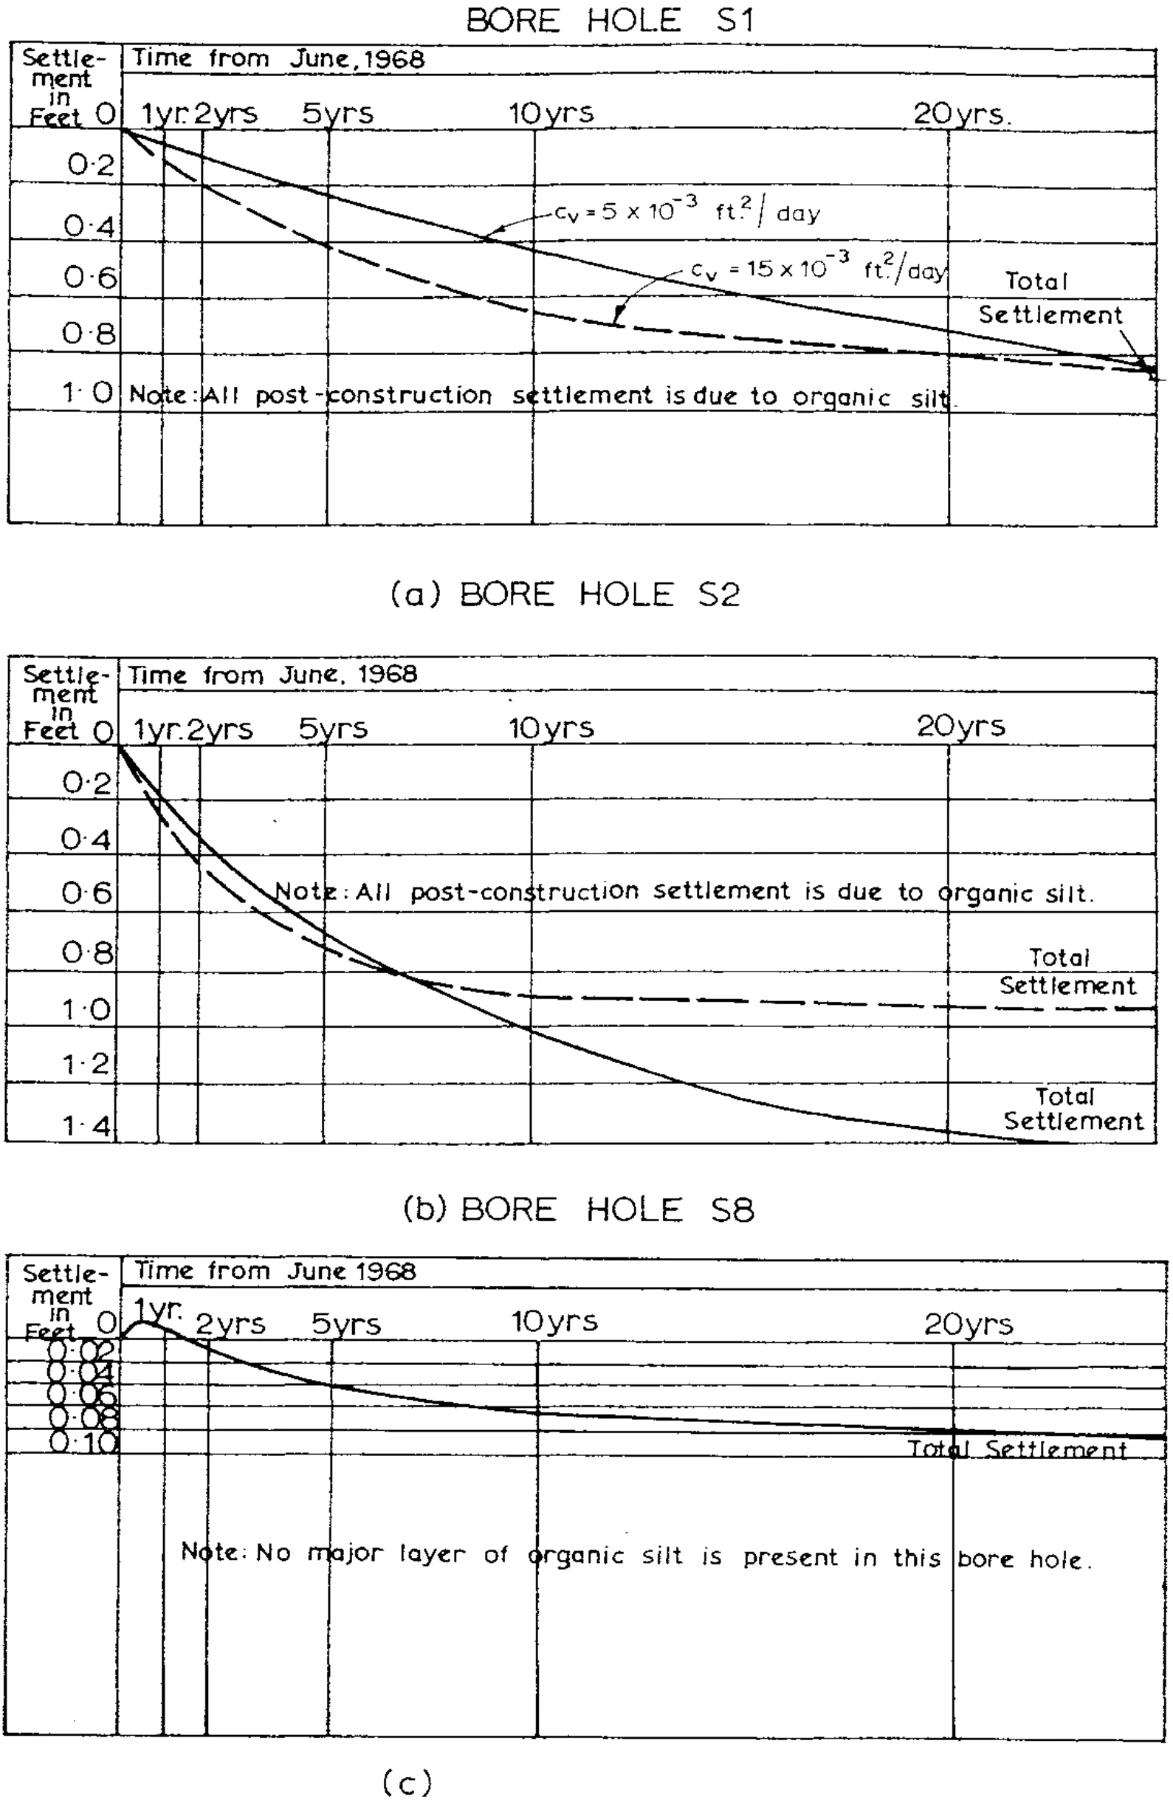
Fig. 10 shows the predicted settlements obtained by a detailed finite-difference analysis of the deposits which took into account the loading history prior to 1966, and the contributions to settlement by each layer. Two theoretical settlement time curves are shown. The dotted lines correspond to a of and the full lines correspond to the value obtained with the small” clear” samples ().
A comparison shows the influence of the accuracy of the coefficient of consolidation on the predicted results. It will be noted in Fig. 10 (a) that the total final post-construction settlement for the more realistic field value () is relatively reduced because of the greater settlement during the surcharge period.
The post-construction settlements of Fig. 10 are similar to the values obtained by considering the silt-clay alone (Tables IV and V). For example, for Site Sl the calculated post-construction settlement after 5 years is 0.43 (Fig. 10 (a)) compared with 0.42 by the approximate method (Table V). At other sites the agreement was within 0.10 ft.
In one area it was necessary to consider the simultaneous consolidation of two contiguous layers of significantly different consolidation properties. This problem was solved by a finite difference approach and is detailed elsewhere (Ref. 4). It was found possible to present the settlement-time behaviour of such a two-layer system in a form which can be used directly in analysis, but for more than two layers a finite difference solution may have to be carried out for each individual case.
4.3 Settlements Due to Surface Loadings:
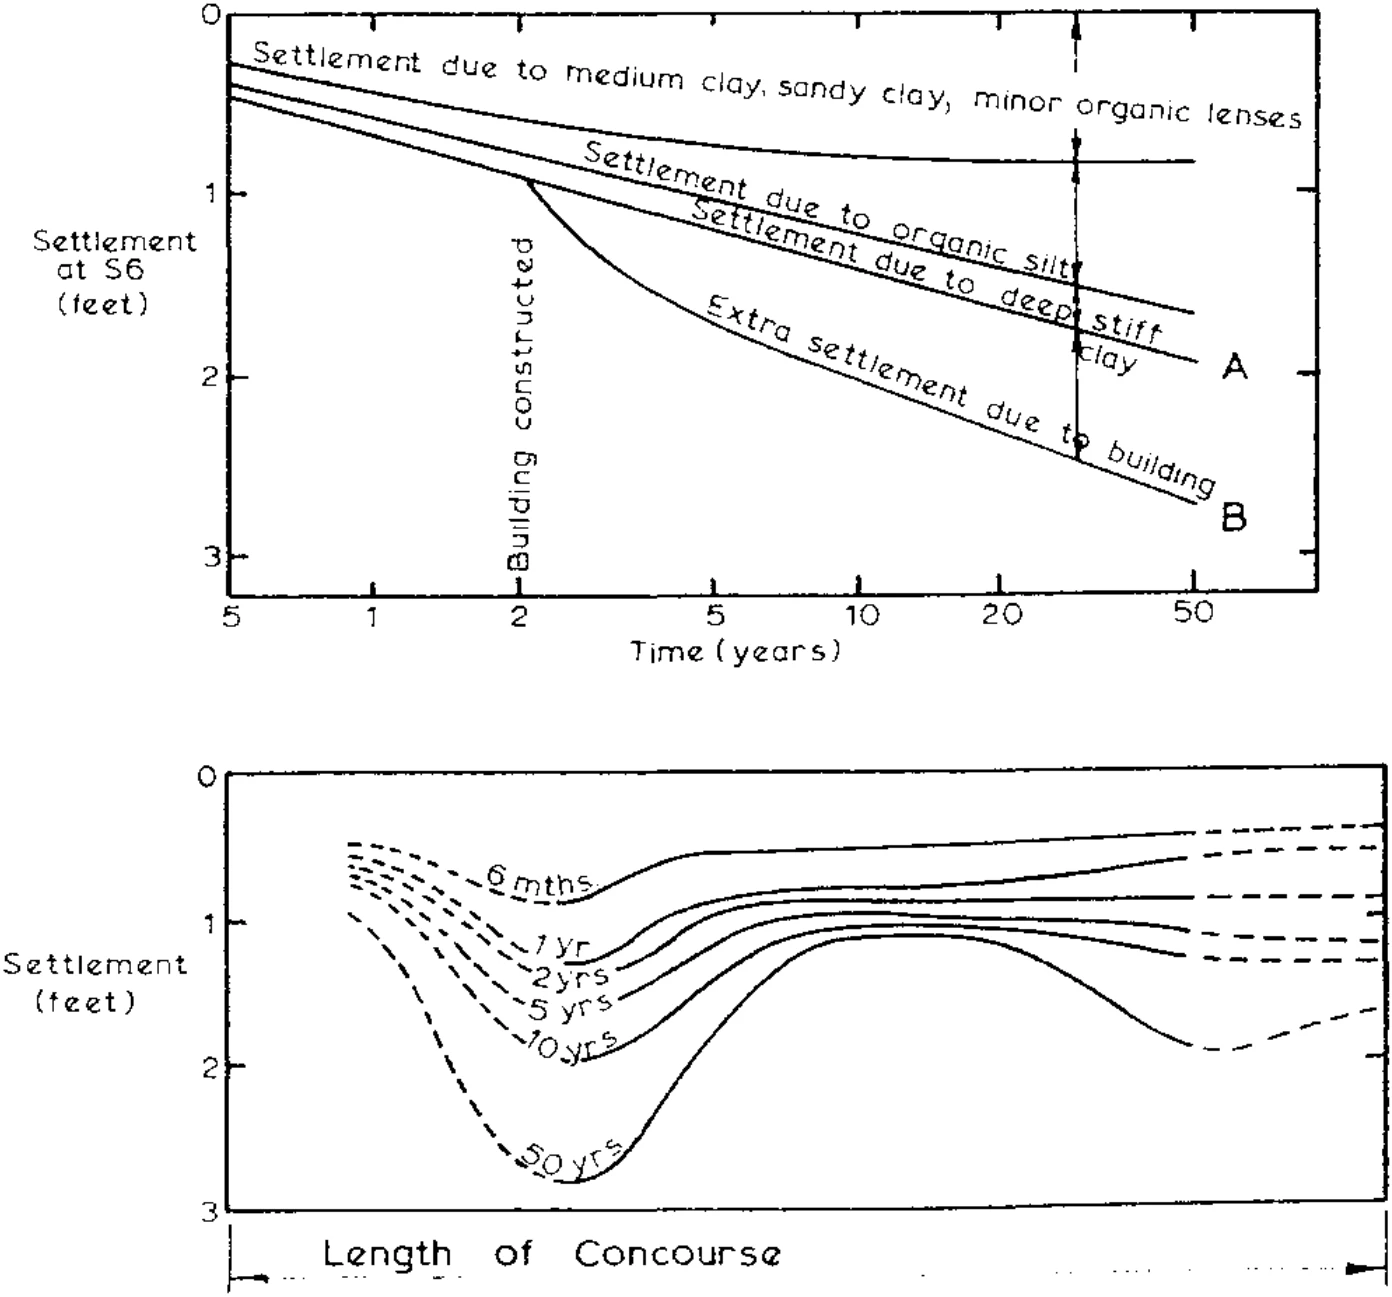
Two further loading cases were considered in detail. As a possible foundation system for the passenger concourse a raft foundation 40 ft. wide superimposing a gross pressure of 0.5 tons/sq. ft. was considered. For the purpose of illustrating the relative magnitude of the extra settlement due to filling and surcharging, two major settlement-time curves are plotted in Fig. 11. Curve A is the consolidation settlement without concourse loading and Curve B includes the extra settlement which would occur if the concourse was placed on a raft foundation. The extra settlement five years after construction was found to be of the order of 7 in. increasing to approximately 11 in. ten years after construction. Of greater importance is that the settlements would not be uniform and the concourse structure would be subjected to rather severe differential settlements unless provision was made to compensate for the local settlements by jacking of the structure as the foundation settled.
The second type of surface loading considered was that due to parked aircraft. Taking into account the likely percentage of the total time aircraft were parked in the area adjacent to the terminal, the total final settlement was found to be 0.32 ft. for the Boeing 747 aircraft. Some creep settlement was predicted so that the total settlement after ten years could increase to 0.45 ft., being composed of 0.25 ft. of creep settlement. However, at the present time, the creep behaviour is not completely understood and the figure of 0.25 ft. can only be regarded as a first estimate of the creep settlement.
A further aspect of settlement considered in relation to the aircraft was the possibility of further compaction of the cohesionless fill by dynamic engine forces transmitted to the ground. Further compaction of such soils is primarily controlled by the maximum acceleration of the imposed vibrations (Refs. 1 and 7). From a study of the maximum acceleration of the out-of-balance forces and the likely damping due to wings and under carriage movement it appeared that the existing density was sufficiently high to obviate further settlement, and special deep seated compaction was considered unnecessary.
5.-CONCLUSIONS
The comparison of predicted and measured settlements clearly established that the long-term settlements are primarily due to compression of the organic silt-clay which occurs in deposits of varying lateral extent and of thickness up to 25 ft. Where the organic silt-clay deposits are relatively thin (less than 5 ft.) compression of the underlying stiffer inorganic clays will be the primary source of long term settlements although the total final settlement is likely to be an order less than in areas where the organic silt-clay is 20-25 ft. thick.
Filling and surcharging for a two-year period virtually eliminates post-construction settlements due to compression of layers other than the organic silt-clay. In areas where the organic silt-clay is 20 ft. thick, filling immediately followed by construction would have lead to a predicted post-construction total final settlement of the order of 18 in. compared with 10 in. for a 5 ft. fill maintained for 2 years prior to construction and 7 in. for fill plus 6 ft. of surcharge maintained for 2 years prior to construction.
The time rate of settlement was most closely predicted by use of the coefficient of consolidation obtained in a test. This was due to the fact that the longer samples used in the test were more representative of the average field element than the thinner “clear” samples used in the oedometer tests. The use of larger than normal samples has also been advocated by Rowe (Ref. 11) where there is a scale effect.
Although the organic silt-clay could be consolidated in limited regions by electro-osmosis, the conductivity of the soil-water system is too high to make the process an economically feasible procedure.
ACKNOWLEDGMENTS
The work described in this paper was carried out by personnel from the Commonwealth Department of Works and the School of Civil Engineering, University of Sydney, under the direction of the senior authors.
The senior authors would like to acknowledge the outstanding co-operation and encouragement of the Commonwealth Department of Works. The authors acknowledge the benefit of discussion and the valuable assistance given by Dr. H. G. Poulos, Senior Lecturer, Civil Engineering, University of Sydney. The paper is published by permission of the Director of Works.
References
- BARKAN, D. D.-Dynamics of Bases and Foundations. New York, McGraw-Hill, 1962.
- BJERRUM, L., MOUM, J. and EIDE, O.-Application of Electro-osmosis on a Foundation Problem in a Norwegian Quick Clay. Geotechnique, Vol. 17, No.3, 1967, pp. 214-35.
- CASAGRANDE, L.-Electro-osmotic Stabilization of Soils. Boston Soc. Civil Engrs., Contributions to Soil Mechanics, Vol. 2, 1941-53, p.285.
- DAVIS, E. H. and LEE, I. K.-One-Dimensional Consolidation of Layered Soils. Proc. Seventh Int. Conf. Soil Mechanics and Foundation Engg., Mexico City, 1969, Vol. 2, p. 65.
- DAVIS, E. H. and POULOS, H. G.-Triaxial Testing and Three-Dimensional Settlement Analysis. Proc. Fourth Aust.-New Zealand Conf. Soil Mechanics and Foundation Engg., Adelaide, 1963, pp. 233-43.
- DAVIS, E. H. and RAYMOND, G. P.-A Non-Linear Theory of Consolidation. Geotechnique, Vol. 15, No.2, 1965, pp. 161-73.
- LAMBE, T. W. and WHITMAN, R. V.-Soil Mechanics. New York, Wiley, 1969.
- ROBERTS, D. V. and DARRAGH, R. D.-Areal Fill Settlements and Building Foundation Behaviour at San Francisco Airport. ASTM Special Tech. Publication No. 322, 1962, pp. 211-30.
- ROWE, P. W.-Measurement of the Coefficient of Consolidation of a Lacustrine Clay. Geotechnique, Vol. 9, No.3, 1959, pp. 107-17.
- ROWE, P. W. and SHIELDS, D. H.-Radial Drainage Oedometer for Laminated Clays. Proc. A.S.C.E., Jour. Soil Mechanics and Foundations Div., Vol. 91, No. SMl, Jan., 1965, pp. 15-23.
- ROWE, P. W.-The Calculation of the Consolidation Rates of Laminated Varved, or Layered Clays, with Particular Reference to Sand Drains. Geotechnique, Vol. 14, No.4, 1964, pp. 321-40.
- KOLBUSZEWSKI, J.-An Experimental Study of the Maximum and Minimum Porosities of Sands. Proc. Second Int. Conf. Soil Mechanics and Foundation Engg., 1948, Vol. 1, pp. 158-62.
* Paper No. 2876, submitted by the authors on 29th October, 1969. The authors are, respectively, Professor Lee, School of Civil Engineering, The University of New South Wales; Professor Davis, Professor of Civil Engineering (Soil Mechanics), The University of Sydney; Messrs. Rodway and Mallam, Engineers with the Commonwealth Department of Works.