Fly ash/Geogrid direct shear tests
Introduction
The internal stability of a reinforced soil structure is generally assessed using limit equilibrium methods. It involves analysing potential failure surfaces of various shapes, usually circles, log spirals or single or multiple planar surfaces (See Ring 1992).
For curved slip surfaces the contribution of reinforcing inclusions to stability is limited by either their breaking strength or by the pull-out resistance of that part of the reinforcement which is beyond the moving soil mass. Planar wedge failures may similarly intersect reinforcement but sliding may also occur directly on the reinforcement layer (Fig. 1).
For smooth reinforcing strips and geotextiles, the pull-out resistance can be conservatively evaluated in a standard direct shear box where the lower half contains a solid block covered with the reinforcement material.
Mesh reinforcement and geogrids have large openings. In addition to soil/reinforcement friction and adhesion, these materials also generate pull-out resistance by developing passive type resistance along crossbars or similar elements lying perpendicular to the direction of tensile forces. For meshes and geogrids, the soil/reinforcement shear strength deduced from pull-out tests may thus be considerably higher than that measured in a direct shear test. Results from pull-out tests should obviously not be used for analysing wedge failures involving direct shear on the reinforcement layer.
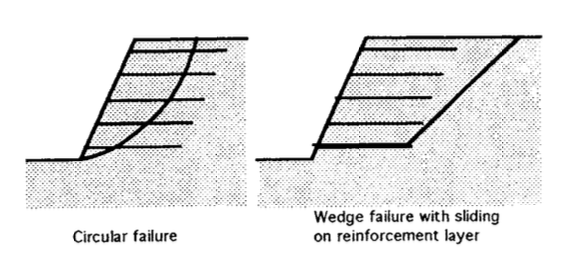
The test results presented in this paper concern direct shear of fly ash on synthetic geogrids. The results are applicable to the analysis of wedge type failures in reinforced walls and embankments built with fly ash. Part of the investigation involved comparing test results obtained for multiple set up tests with those from single set up or “stage” tests.
Material Properties
Fly Ash
The fly ash was obtained from Vales Point Power Station. Its particles are predominantly of silt size. It has a low unit weight and a relatively high friction angle, two properties which make it attractive as a backfill for reinforced soil structures. The low unit weight produces less foundation settlement and lower earth pressures (thus requiring less reinforcement) than ordinary soil backfills. An additional benefit is that in the long term pozzolanic reactions tend to increase the strength of fly ash. Using synthetic geogrids as reinforcement avoids any problem of corrosion.
For the shear testing, the fly ash was compacted as near as possible to Standard maximum dry density at its optimum water content:
| Optimum water content | |
| maximum dry density |
In the shear box the fly ash was compacted in three layers when tested for the internal friction angle φ, and two layers when tested for the skin friction angle δ with the geosynthetic. The density of the compacted ash was controlled by compacting a predetermined amount of wet ash into the shear box until the desired height was achieved. Densities from 96% to 100% of the Standard Proctor density were achieved.
For the fly ash/geogrid testing the geogrid was glued to a plywood board and placed flush with the top of the lower half of the box. Coarse sand was glued onto the board between the grid elements. This was done in order to create shear within the ash itself within the area of the geogrid openings.
Geogrids
The testing program, which is still in progress, involves a number of different geogrids. The results presented here concern Tensar geogrids (punched and drawn sheet of polypropylene) and Paragrid (intersecting flat strips of polyester fibres encased in polyethylene).
Test Procedures
Shear box apparatus
The tests were carried out in a large shear box (sample dimensions 300 mm by 300 mm by 180 mm), the bottom half fixed and the top half allowed to slide up to 25 mm horizontally. Graphite was used to reduce the internal friction of the shear box; this friction was measured and used to correct the shear test results. The shear box was instrumented, with the horizontal and vertical displacements being monitored by LVDTs. The horizontal load was applied through a 50 kN load ring with a LVDT calibrated in kilonewtons. The vertical load was applied hydraulically through a 50 kN load ring. Vertical displacements, horizontal displacements and loads were recorded with a Datataker and transferred into a spreadsheet on a personal computer. The rate of shear was kept constant at 1.0 mm/min. This rate was chosen to reflect other work by Boot (1990), Bergado et al (1992, 1993) and Jones et al. (1990).
All the independent shear tests were carried out according to ASTM 5321-92 “Standard Test Method for Determining the Coefficient of Soil and Geosynthetic or Geosynthetic and Geosynthetic Friction by the Direct Shear Method”.
Standard Tests
In the standard or “multiple set up” tests a new specimen was prepared for shearing at each of the normal pressures.
Stage Tests
Stage testing or “single set up” testing involves shear testing of the same sample at four different overburden stresses. The advantages of stage testing over standard testing are:
- The initial density and moisture content is identical for all four tests.
- The testing time is reduced to almost one quarter of the time as compared to four independent tests.
- Not much material is required for the test reducing time required for sampling and batching.
The disadvantages of stage testing are:
- The true peak shear stress of the second, third and fourth stage is not recorded and thus the friction angle determined is less than the peak friction angle deduced from the four independent tests.
- There is no check on the individual tests. If the whole sample is compacted incorrectly or the shear plane is disturbed, all stage tests will be affected.
Results
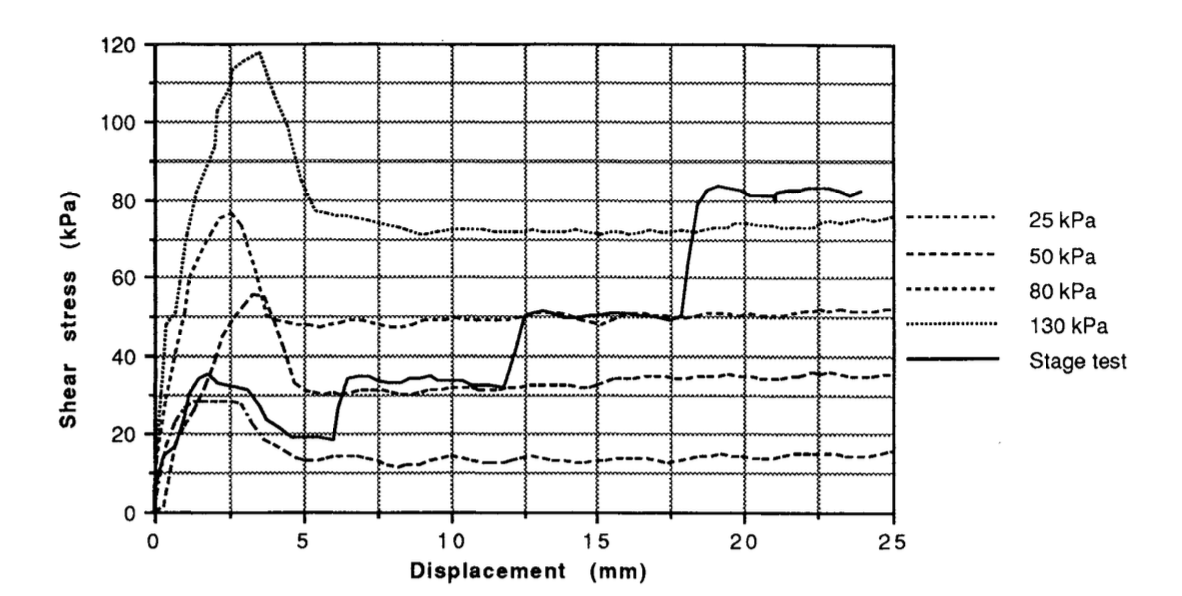
The development of shear stress with horizontal displacement in fly ash alone is shown in Fig. 2 for standard and stage testing.
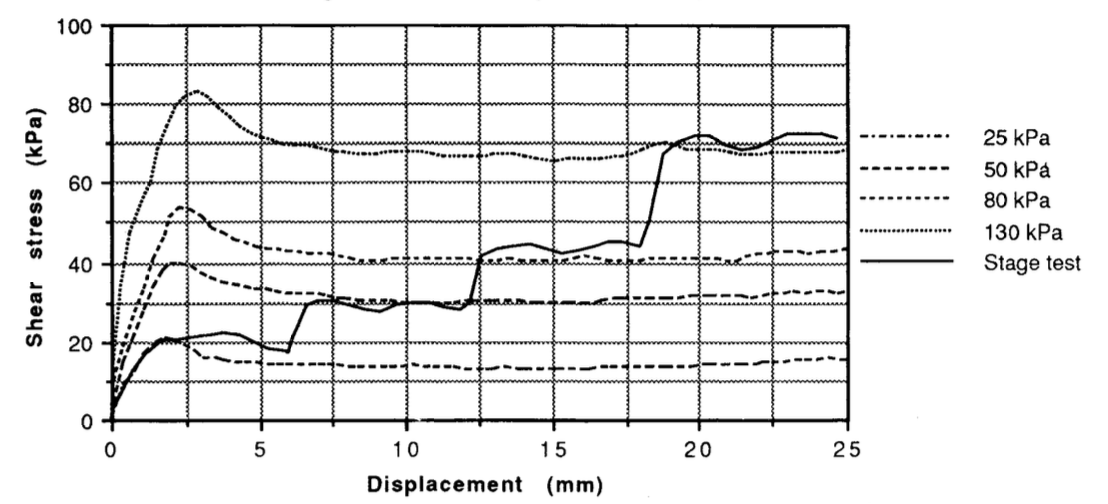
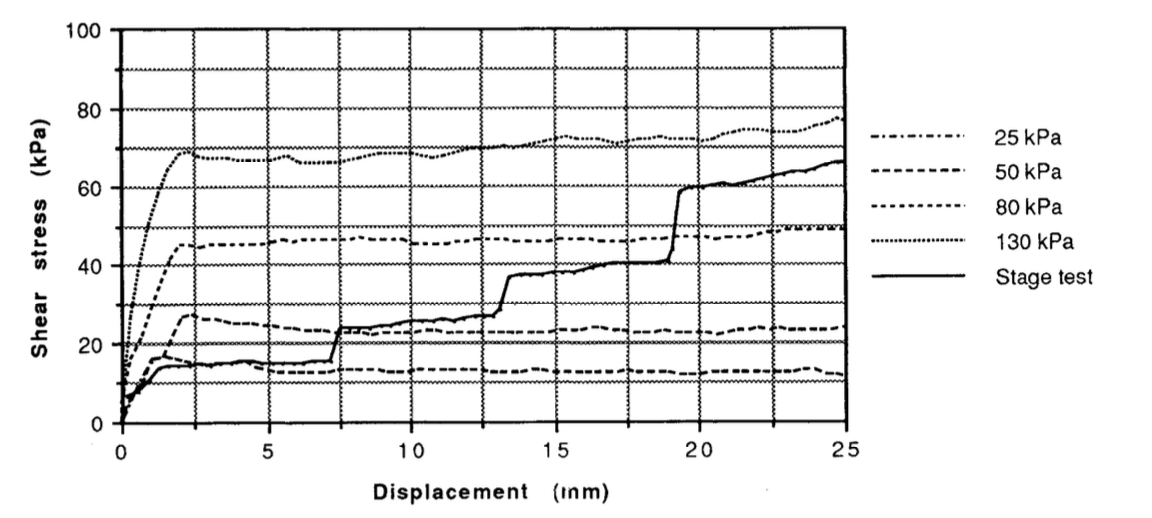
The results of a series of tests of fly ash sliding on Tensar SS2 and Paragrid are given in Figs. 3 and 4 respectively.
Results obtained for ash alone as well as ash and geogrids are given in terms of shear strength parameters in Tables 1 and 2.
Discussion
Individual direct shear testing of compacted fly ash alone show a peak friction angle of about 40°, with a corresponding cohesion of 10 kPa. Residual values are considerably lower, close to those reached in stage testing (<I> = 28.4° and c = 4.8 kPa). Peaks of shear strength, as indicated by individual testing of ash on geogrids, are less pronounced and occur slightly earlier than in ash alone (say at 2 rather than 3 mm displacement). Tests with Paragrid did not reveal any distinct peak shear stresses at all (Fig. 4).
Stage testing beyond initial shearing gives magnitudes of shear strengths corresponding reasonably well with residual values from multiple set up tests. Similar findings were reported by Bemben and Schulze (1993) for sand shearing on geomembranes.
Peak friction angles δ for fly ash sliding on various geogrids ranged from 26° to 30°, residual friction angles deduced from standard an stage testing varied from 20° to 28°. Peak cohesion values were higher than residual cohesions in all but one test.
| Test material | Standard tests Peak values | |
|---|---|---|
| φ or δ (˚) | C (kPa) | |
| Fly ash alone | 39.7 | 10.4 |
| Tensar SR110 | 25.7 | 11.7 |
| Tensar SS2 | 30.0 | 8.2 |
| Paragrid 100/25s | 26.9 | 3.6 |
| Test material | Standard tests Residual values | Stage tests | ||
|---|---|---|---|---|
| φ or δ (˚) | C (kPa) | φ or δ | C (kPa) | |
| Fly ash alone | 28.1 | 3.2 | 28.4 | 4.8 |
| Tensar SR110 | 24.0 | 5.8 | 20.3 | 12.6 |
| Tensar SS2 | 27.5 | 1.9 | 27.7 | 3.4 |
| Paragrid 100/25s | 26.9 | 0 | 24.1 | 2.6 |
Conclusions
Based on the test results presented conclusions can be drawn with respect to the methods of analysis appropriate for geogrid reinforced fly ash structures, the choice of design parameters, and the feasibility of stage testing in lieu of standard, multiple set up of shear testing.
Fly ash/geogrid shear resistance can be significantly lower than the internal shear strength of fly ash alone, mainly depending of the type of geogrid used. It is therefore appropriate to analyse potential failure wedges involving sliding on the ash/geogrid interface. This should be done in addition to checking failure modes involving reinforcement breakage and pull-out.
Whether peak or residual shear strength values are used in the design, will depend on the design philosophy adopted.
This investigation has shown that stage testing can be a cost effective way of determining the residual shear strength parameters for fly ash sliding on a geogrid.
Acknowledgements
The work reported in this paper is part of a research program on fly ash/geosynthetic interaction sponsored by the Ash Development Association of Australia. This program aims at producing design guidelines for geosynthetic reinforced fly ash walls and embankments. The tests were carried out in the Soils Laboratory at the University of Technology, Sydney. The support by the School of Civil Engineering and the technical assistance of Tony Lah and Warwick Howse is gratefully acknowledged.
References
Bemben, S.M. and Schulze, DA (1993) “The influence of selected testing procedures on soil/geomembrane shear strength measurements”, Proc. Geosynthetics 93 Conference, Vancouver, Canada, pp. 619-631.
Bergado,D.T., Chai, J.C. and Balasubramaniam, AS. (1992). “Interaction Between Grid Reinforcement and Cohesive-Frictional Soil”, Proc. of Earth Reinforcement Practice Conference, Balkema, pp. 29-34.
Bergado, D.T., Chai, J.C., Abiaro, MC. and Balasubramaniam, A.S. (1993). “Interaction between cohesive-frictional soil and various grid reinforcements”, Journal of Geotextiles and Geomembranes, Vol. 12, No.4, pp. 327-349.
Boot, G.T. (1990). “The Results of Pull-out Tests Carried out in PFA on a Reinforced Earth Structure in South Wales”, Performance of Reinforced Soil Structures, British Geotechnical Society, pp. 85-86.
Jones, C.J.F.P., Cripwell, J.B. and Bush, D.L. (1990). “Reinforced Earth Trial Structure for Dewsbury Ring Road”, Proc. of Inst. Civil Engineers Part 1, April 1990, pp. 321-345.
Ring, G.J. (1992). “The analysis and design of soil stabilised by inclusions”, Soil and Rock Anchorage, Rock Bolting, Soil Nailing and Dowelling, Ground Modification Seminar, No.2, University of Technology, Sydney, pp. 23-50.