Centrifuge testing to assess consolidation behaviour of mine tailings
This paper presents the results of a centrifuge model study of impounded gold mine residue or tailings produced at Boddington Gold Mine in Western Australia. The centrifuge modelling technique was used to replicate the staged filling of the tailings impoundment to assess both the short and long term consolidation behaviour of the tailings. At the time of testing, filling of the impoundment was nearly complete, and field data were available for comparison at various stages in the model construction. The good agreement between the field and centrifuge model data allowed predictions of the future behaviour of the tailings to be made with a high degree of confidence.
1. Introduction
Centrifuge testing of tailings or residue has been performed to model the placement and consolidation of the process residue from Boddington Gold Mine in Western Australia. The effect of the centrifuge testing is to increase the self-weight stresses in the small scale model to those present in the prototype. Consequently the stress level dependent behaviour of the material is preserved. Furthermore, the reduced length of drainage paths in the model (reduced by the scaling factor) significantly reduce the consolidation times in the model. Thus 1 year in prototype time can be represented by approximately 1 hour in the centrifuge at an enhanced acceleration of 100 gravities. The full time for filling the storage area and allowing for possible long term consolidation up to a 20 year period can be modelled in 1 to 2 days. Data from the centrifuge testing have been compared with field data obtained for the R4 residue disposal area and have been used to obtain estimates of:
- densities for each layer during placement and during long term consolidation;
- average densities during placement and long term consolidation;
- surface and underdrainage volumes during placement of the residue and after completion of placement;
- strength increase of the residue at various stages of placement;
- short and long term settlements.
2. Centrifuge Modelling
The centrifuge modelling technique is now firmly established in the field of Geomechanics. The method is particularly useful for problems involving;
self-weight loading (provided automatically by the enhanced weight of the soil);
consolidation or other diffusion processes – due to the small dimensions of the model in the increased acceleration field).
In order to correctly replicate a prototype response in a small scale model it is necessary to develop scaling relationships which link the model behaviour to that of the prototype. In order to derive these relationships the various physical factors which determine the prototype response must be identified and scaled accordingly in the model. For example, it can be shown that if the model pore fluid and intrinsic permeability are the same as those in the prototype then the centrifuge time scale (t) is related to a corresponding prototype time scale by the following expression
where is the centrifuge acceleration level and the subscripts ‘‘ and ‘‘ refer to prototype and model respectively.
Consequently, for a model times the prototype scale, and if both model and prototype materials have the same properties, then the excess pore pressure dissipation will occur times faster in the model than in the corresponding prototype, i.e. 1 day of consolidation at an acceleration of 100g, is equivalent to 27 years at prototype scale.
Further details of centrifuge scaling laws and applications of the centrifuge in consolidation studies can be found elsewhere, for example, Croce et al. (1984), Fahey and Toh (1992).
The centrifuge tests reported here were performed on the geotechnical centrifuge at the University of Western Australia (D.W.A). The U.W.A centrifuge is a 40g-tonne machine with a maximum payload of 200 kg at an acceleration level of200g. Proportionally heavier packages may be tested at lower acceleration levels. Details of the operating capabilities of the machine can be found in Randolph et al. (1991). The centrifuge model tests reported here were performed at enhanced acceleration levels of 100 gravities (100g).
3. Test Programme
The centrifuge tests were able to assess the short and long term consolidation characteristics of the residue as placed at the deepest section of the R4 residue disposal area with a maximum final depth of 27m.
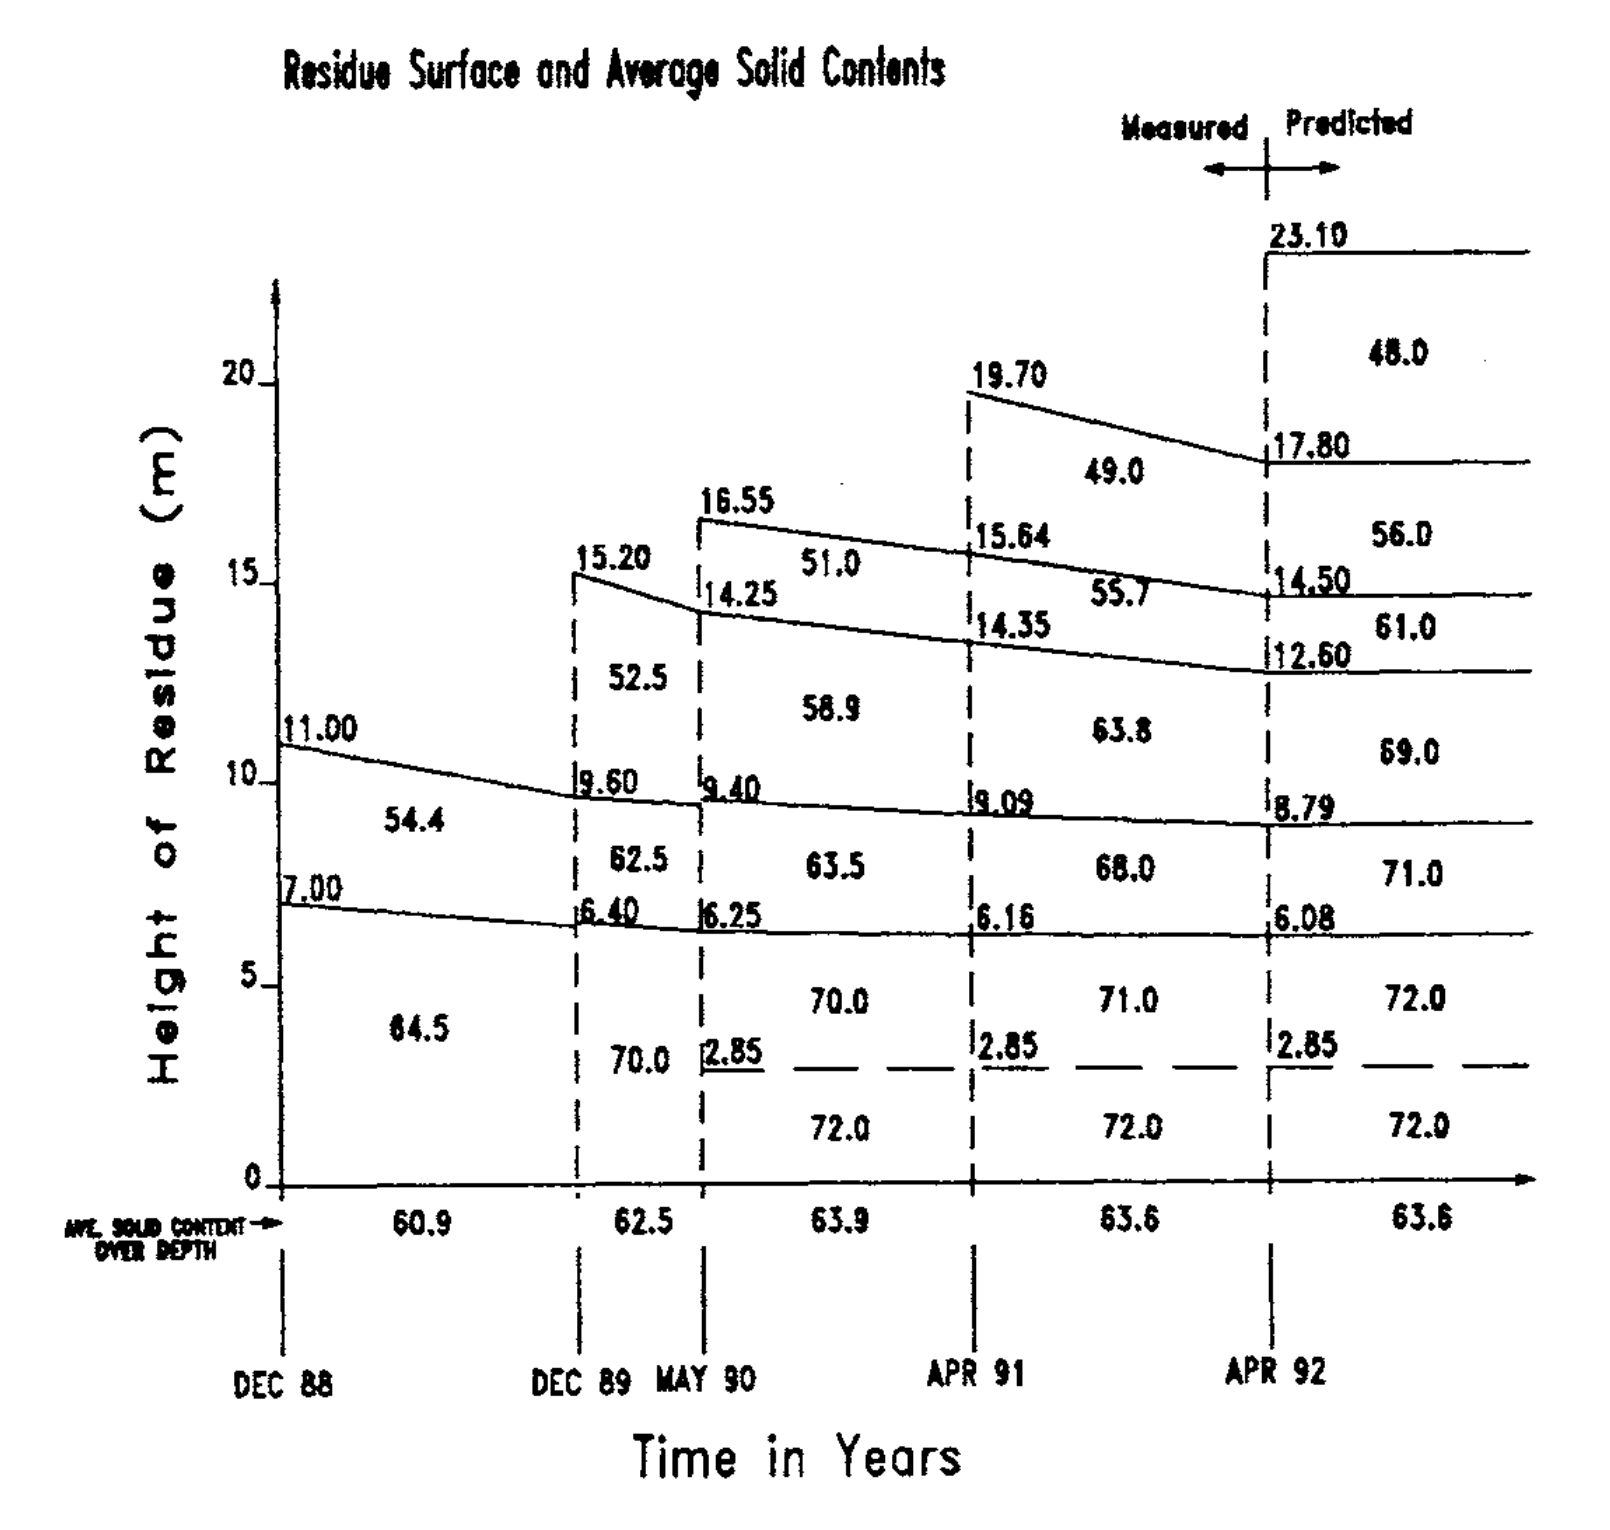
Monitoring of the residue surface and average solids content throughout the depth of the R4 storage area has been regularly conducted since December 1988 and provide a basis for comparison against the model performance. The centrifuge testing was performed in two stages consisting of:
- Test 1 – a reproduction of the history of residue placement to a final height of 27 m;
- Test 2 – a long term consolidation behaviour of the model constructed in the first stage.
An initial solids content of 38% was used in the test, replicating the average placed solids content in R4. “In flight” measurements carried out whilst the model was spinning included fluid and residue levels, pore pressure dissipation and strength profiles. At the end of each stage of filling and at the end of the test the amount of surface and underdrainage was measured, whilst solids contents and layer thicknesses were deduced from relatively undisturbed 10 mm tube samples.
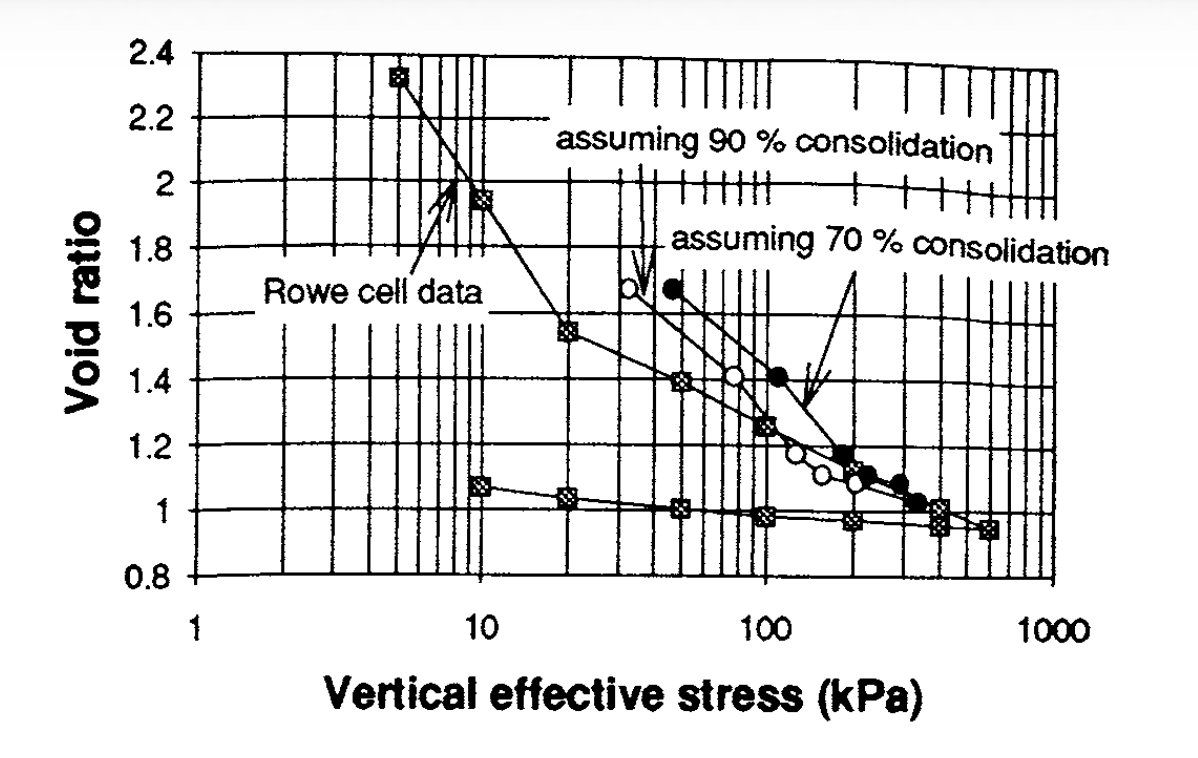
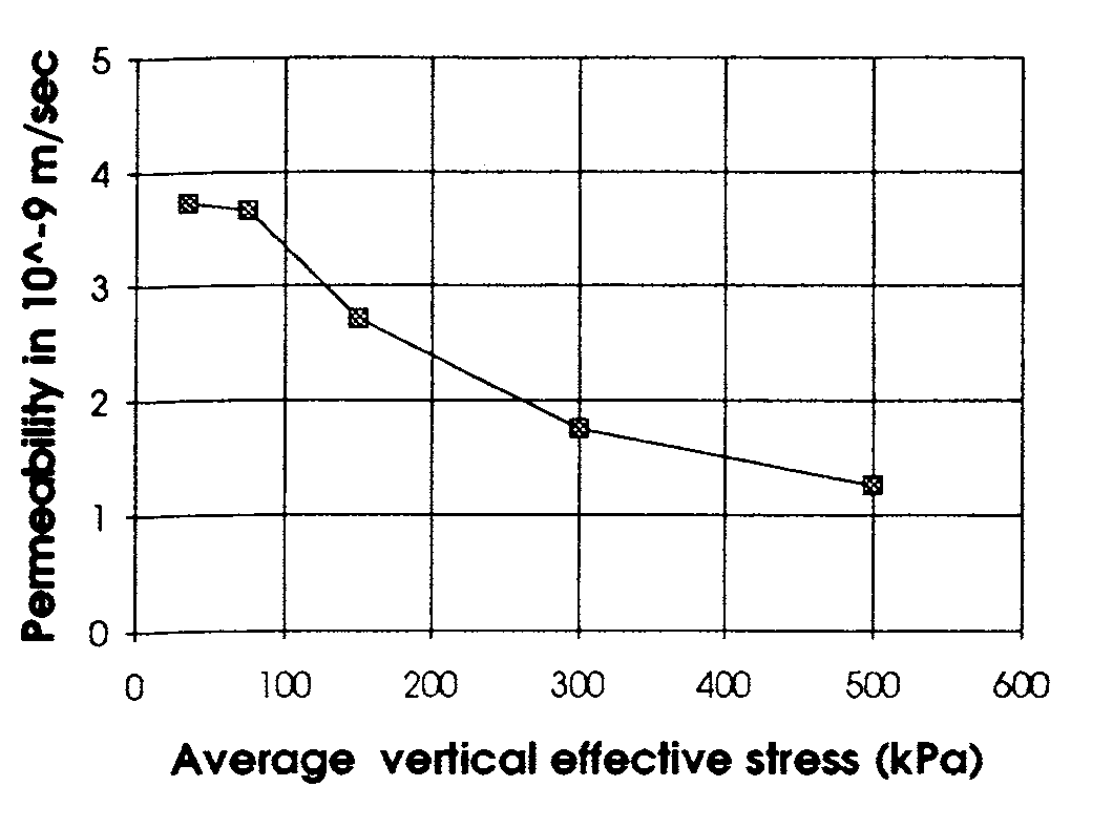
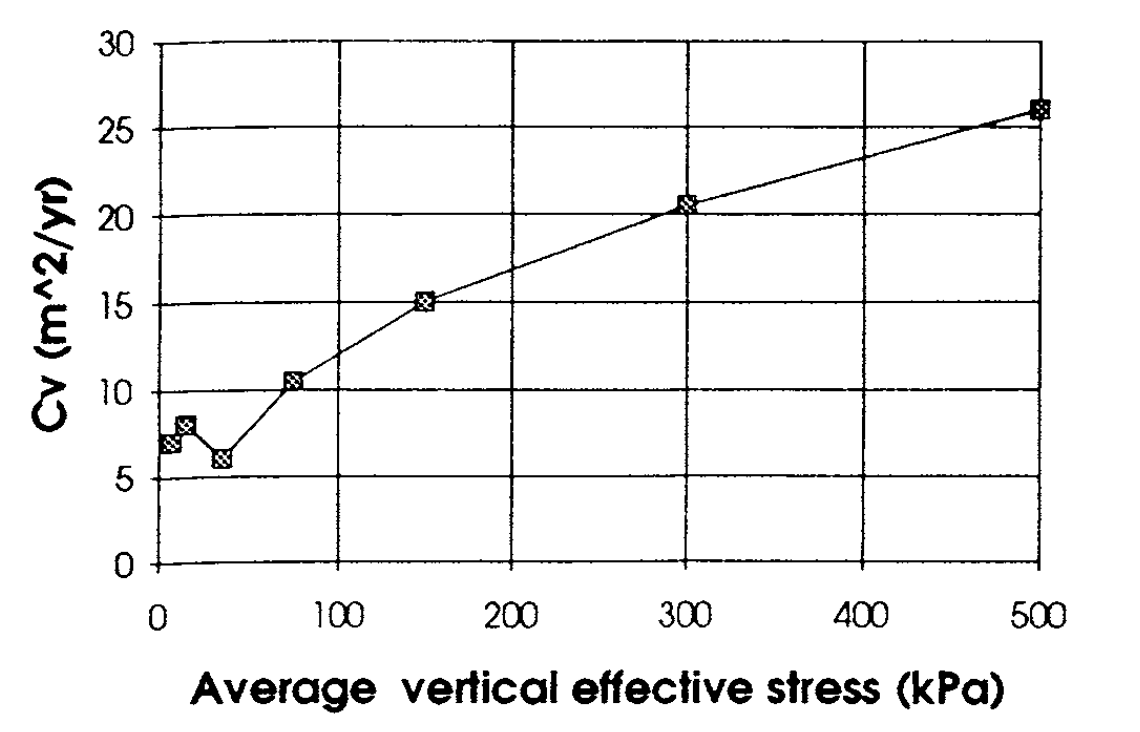
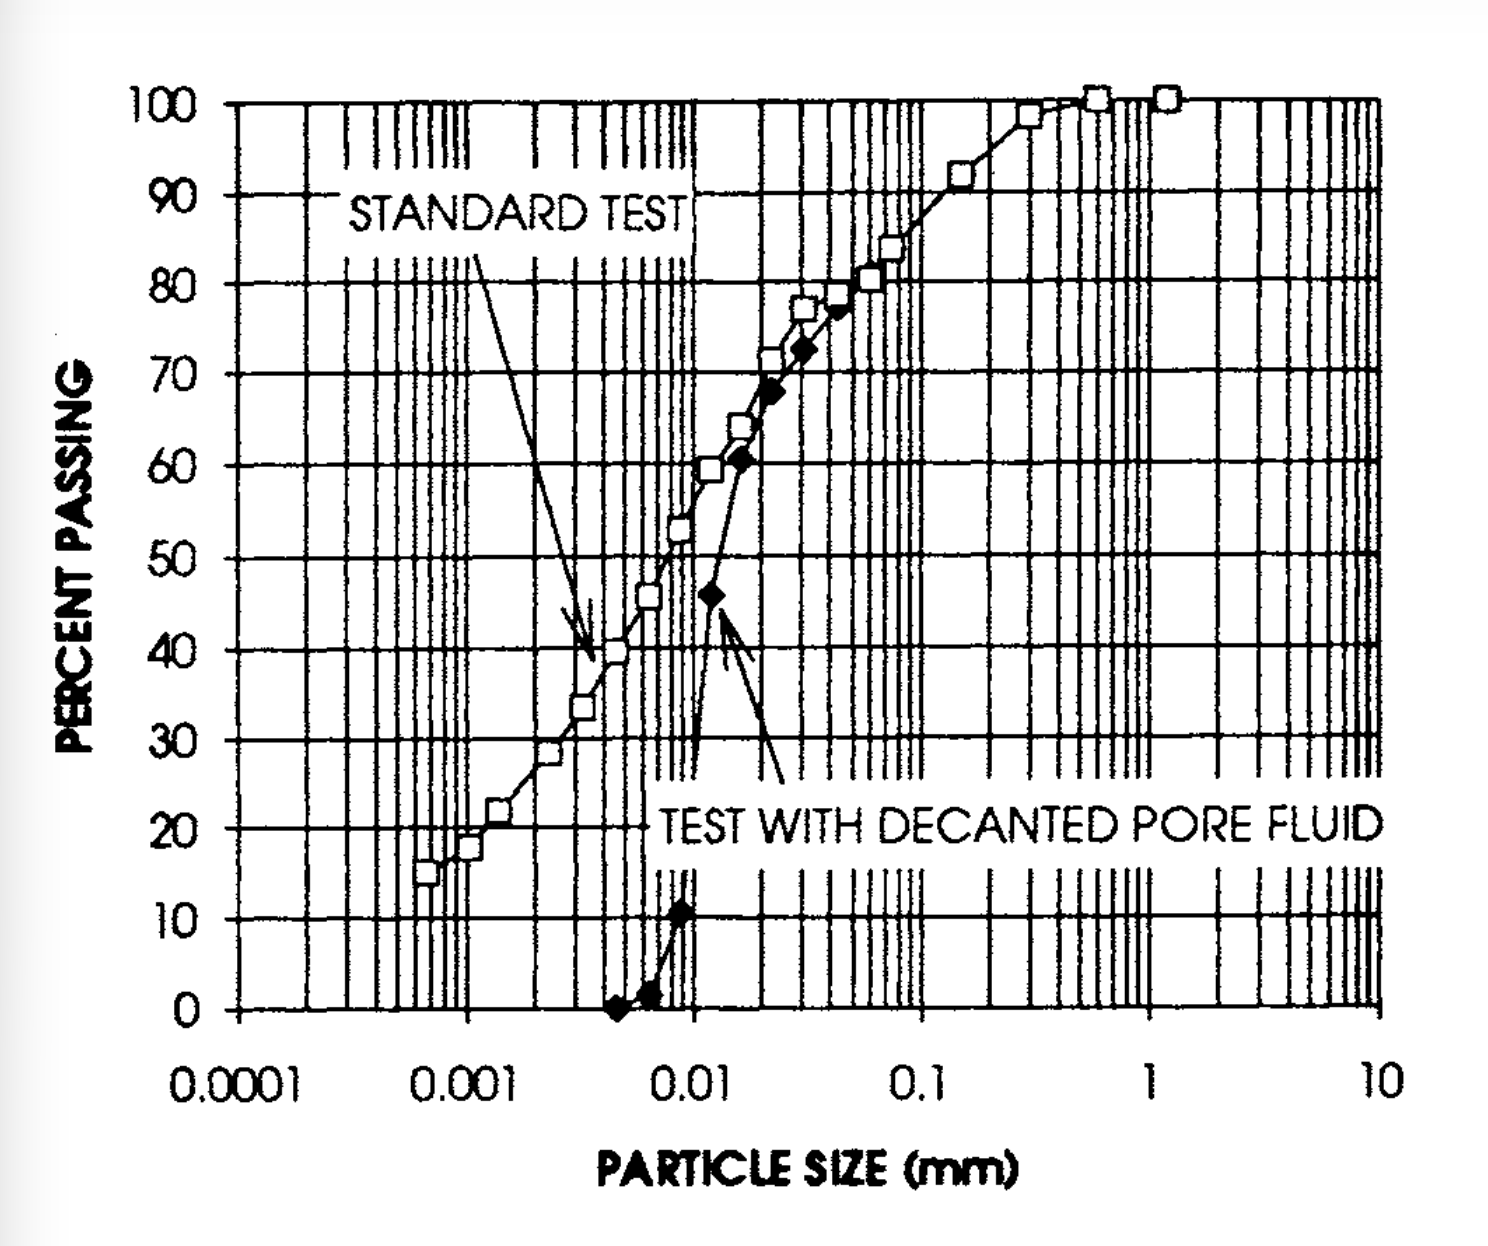
In addition to the centrifuge testing, Rowe Cell consolidation tests, as shown in Figure 1, were performed to derive basic consolidation parameters for comparison with the centrifuge and field data. Two hydrometer tests were performed on the residue. One of these tests conformed to the Australian Standard procedure (AS 1289) but the other test was performed using the decanted residue fluid and without a dispersant. The results from both tests are presented in Figure 2.
The results obtained from the centrifuge testing are applicable to the maximum depth section (27 m) of the R4 storage facility. Further details of the test programme can be found in Stone et al. (1993).
4. Test Results
4.1 Model Construction
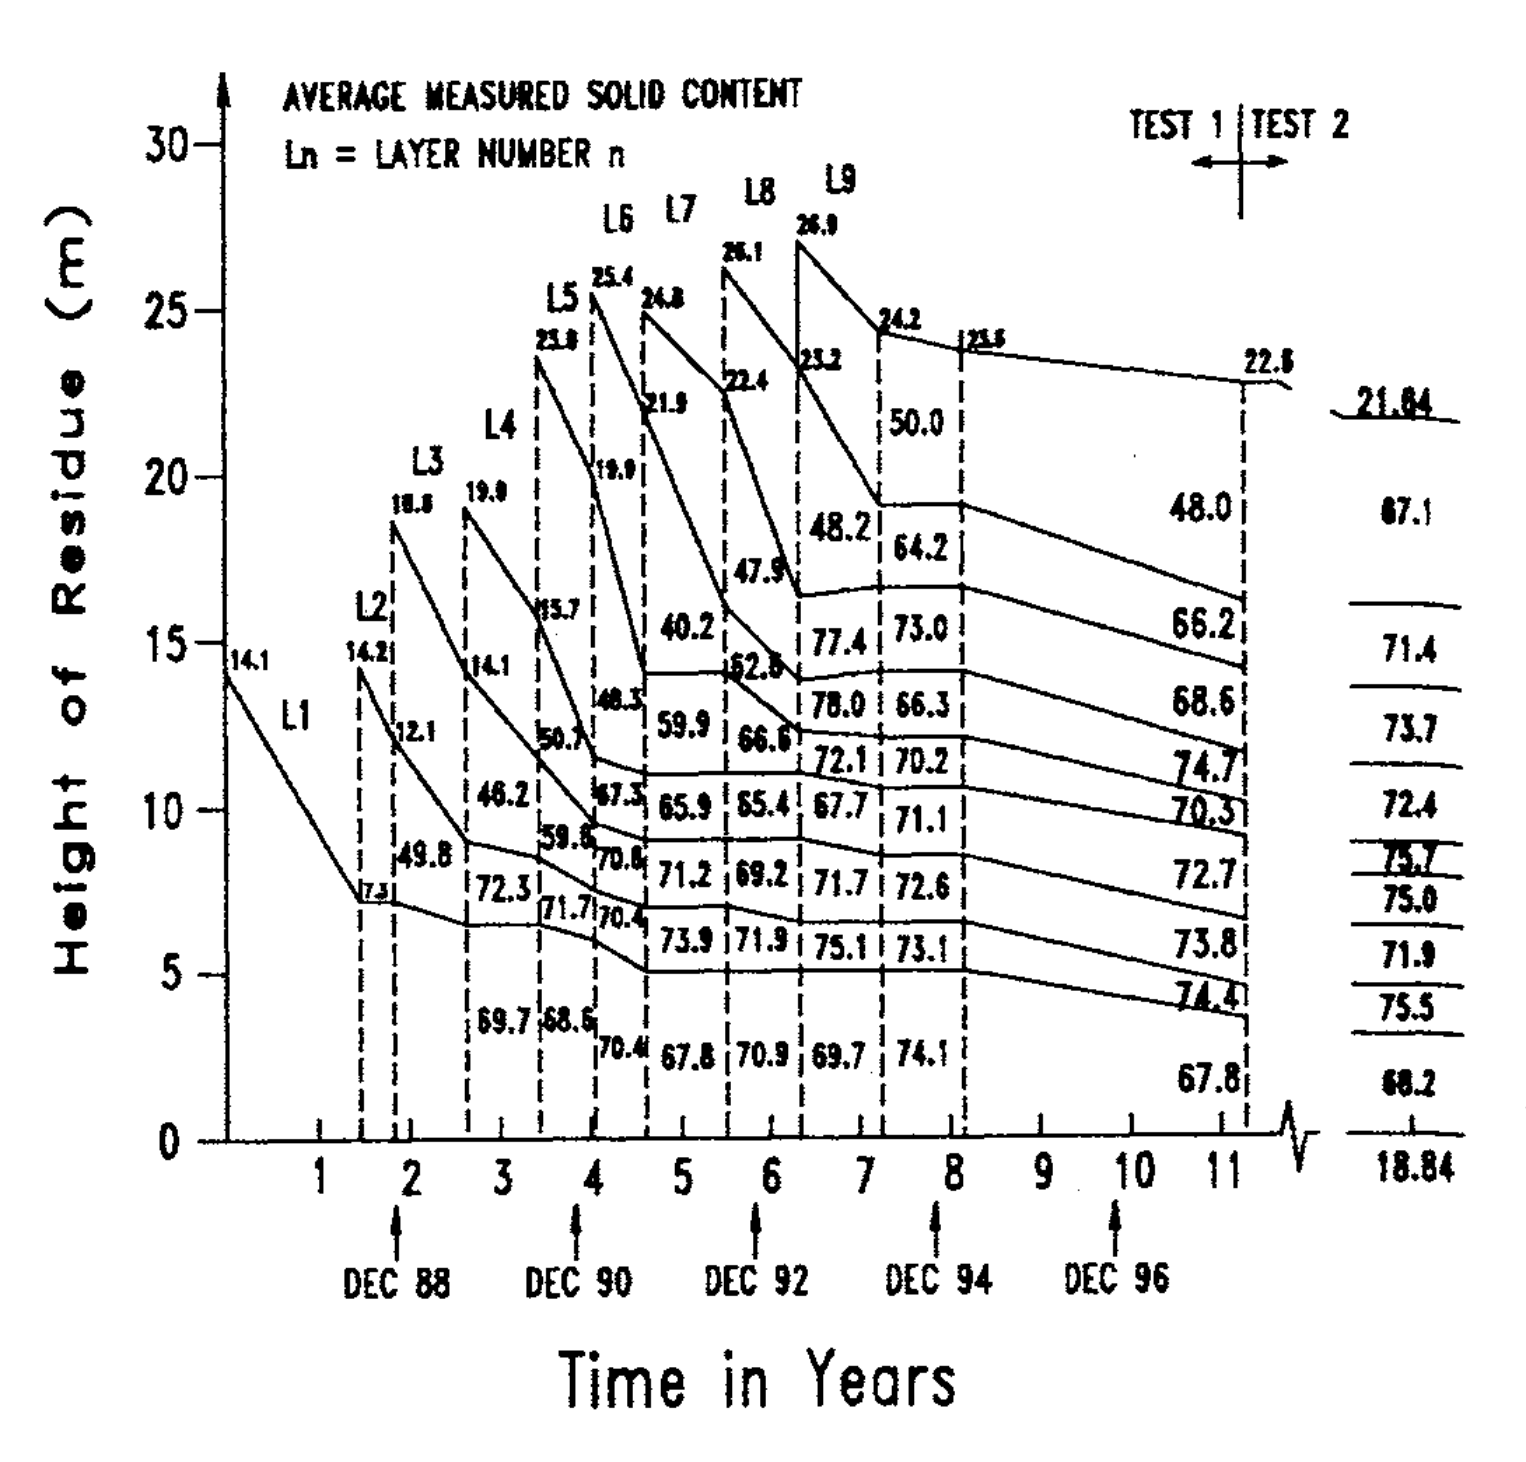
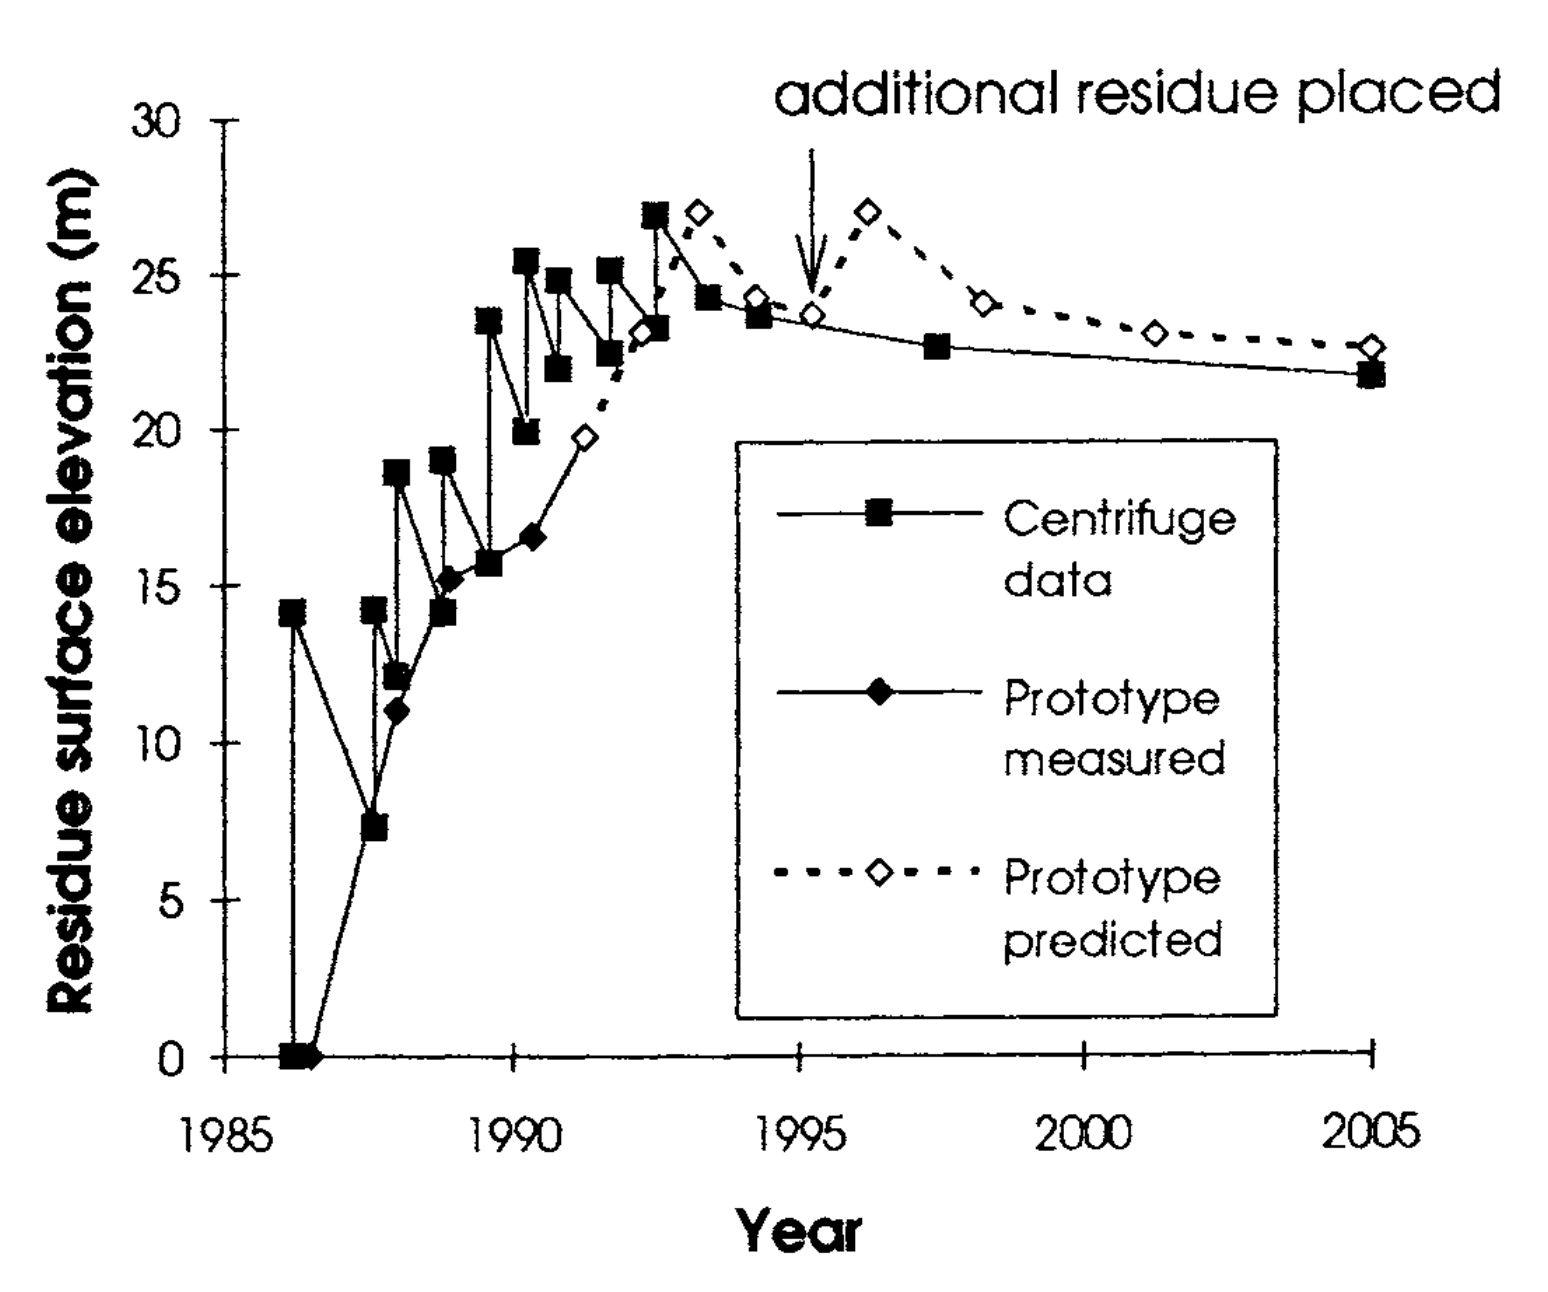
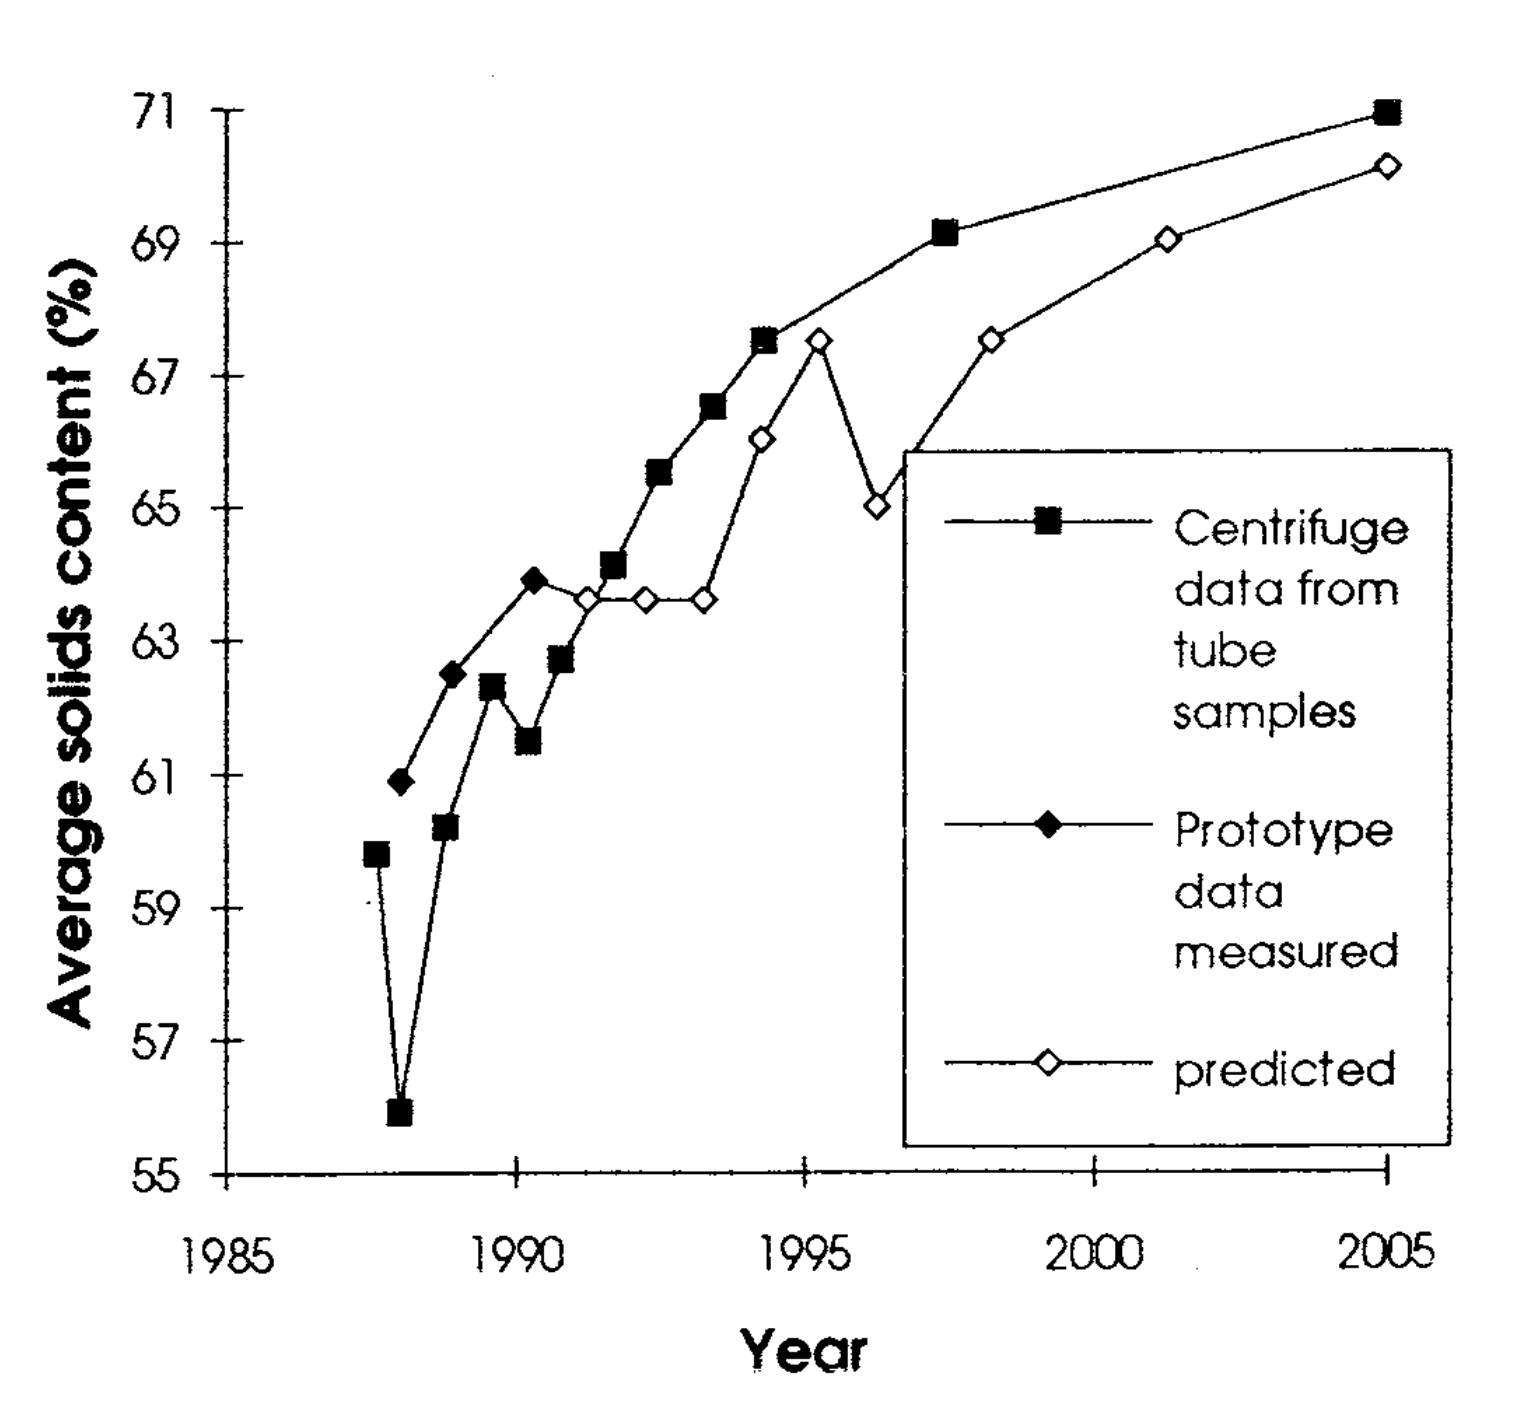
In Test 1 nine layers of residue were placed and consolidated in the centrifuge model to achieve an equivalent prototype residue depth of 27 m, as shown in Figure 3. An overview of the model construction is shown schematically in Figure 4. A comparison of the residue height measured and predicted in the field with those obtained in the centrifuge test is shown in Figure 5, and comparisons of average solids content are shown in Figure 6.
4.2 Settlement
The model simulated residue placement in the R4 disposal area to a maximum depth of 27 m over a period of 6.4 years (Figure 4), After filling to maximum height, the settlement was approximately 2.8 m occurring after 1 year, 3.5 m after 2 years and 5.4 m after 12 years. Primary consolidation was complete some 4 years after final placement with an associated settlement of approximately 4 m.
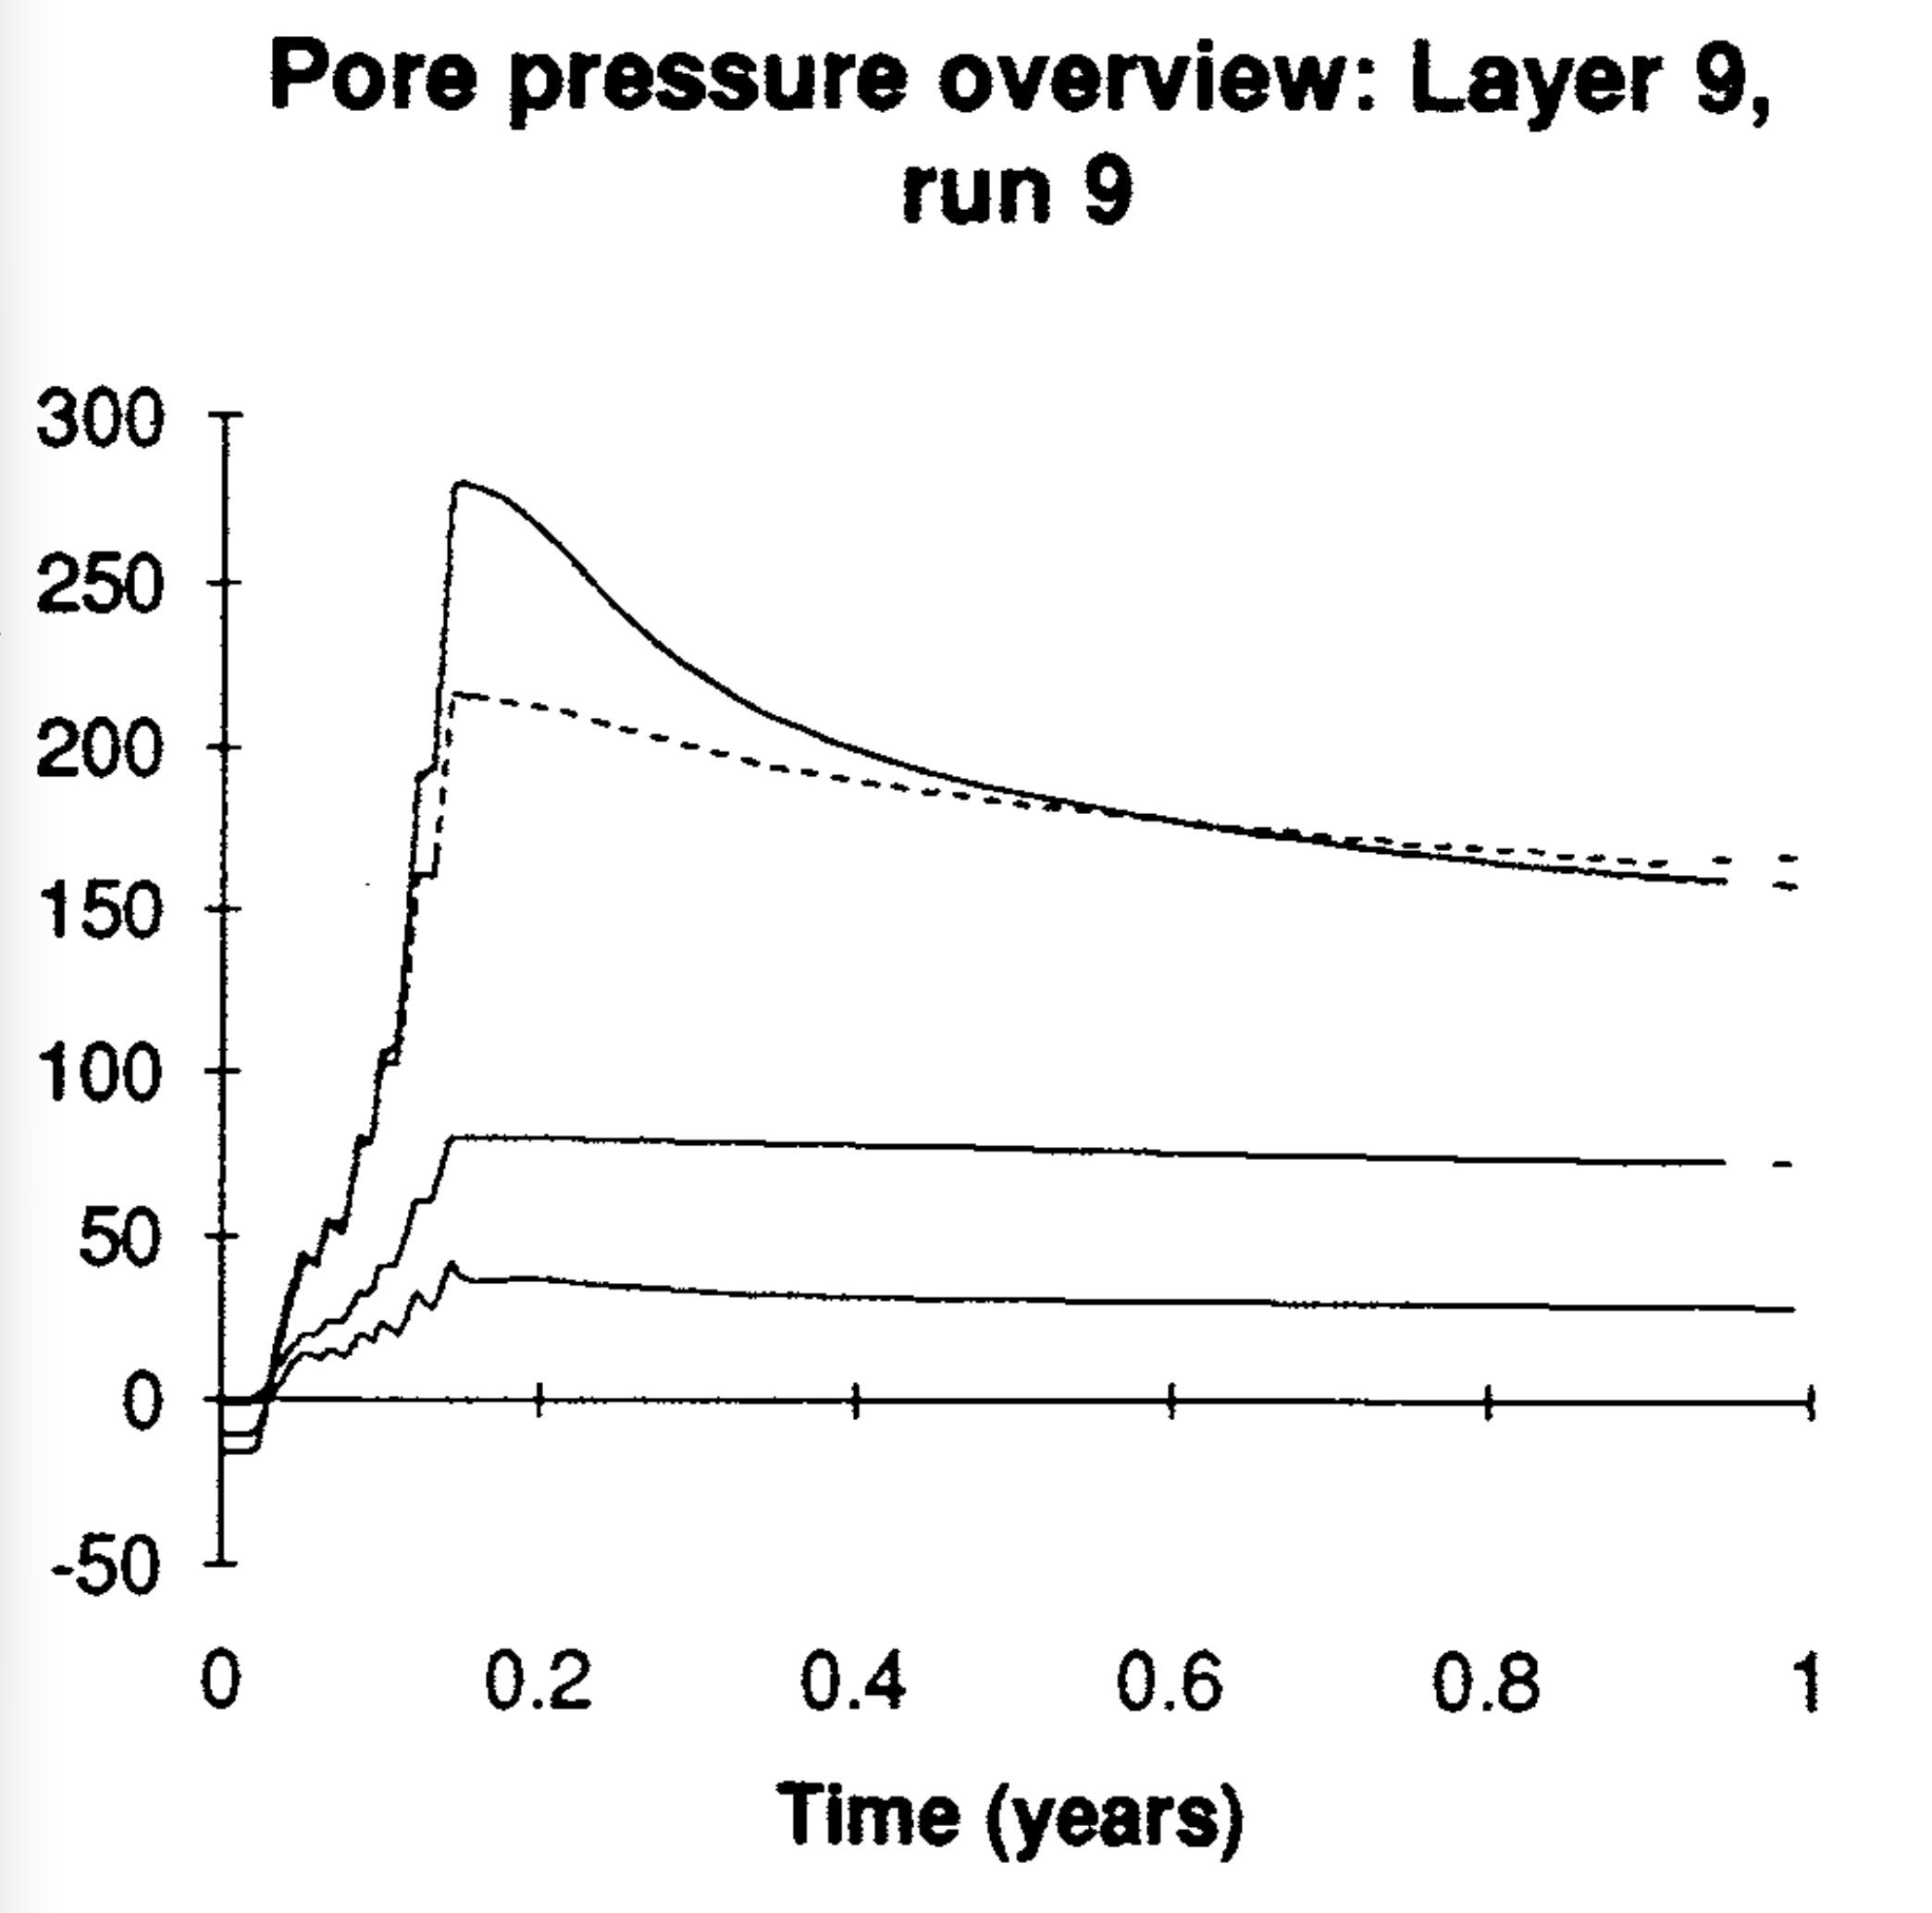
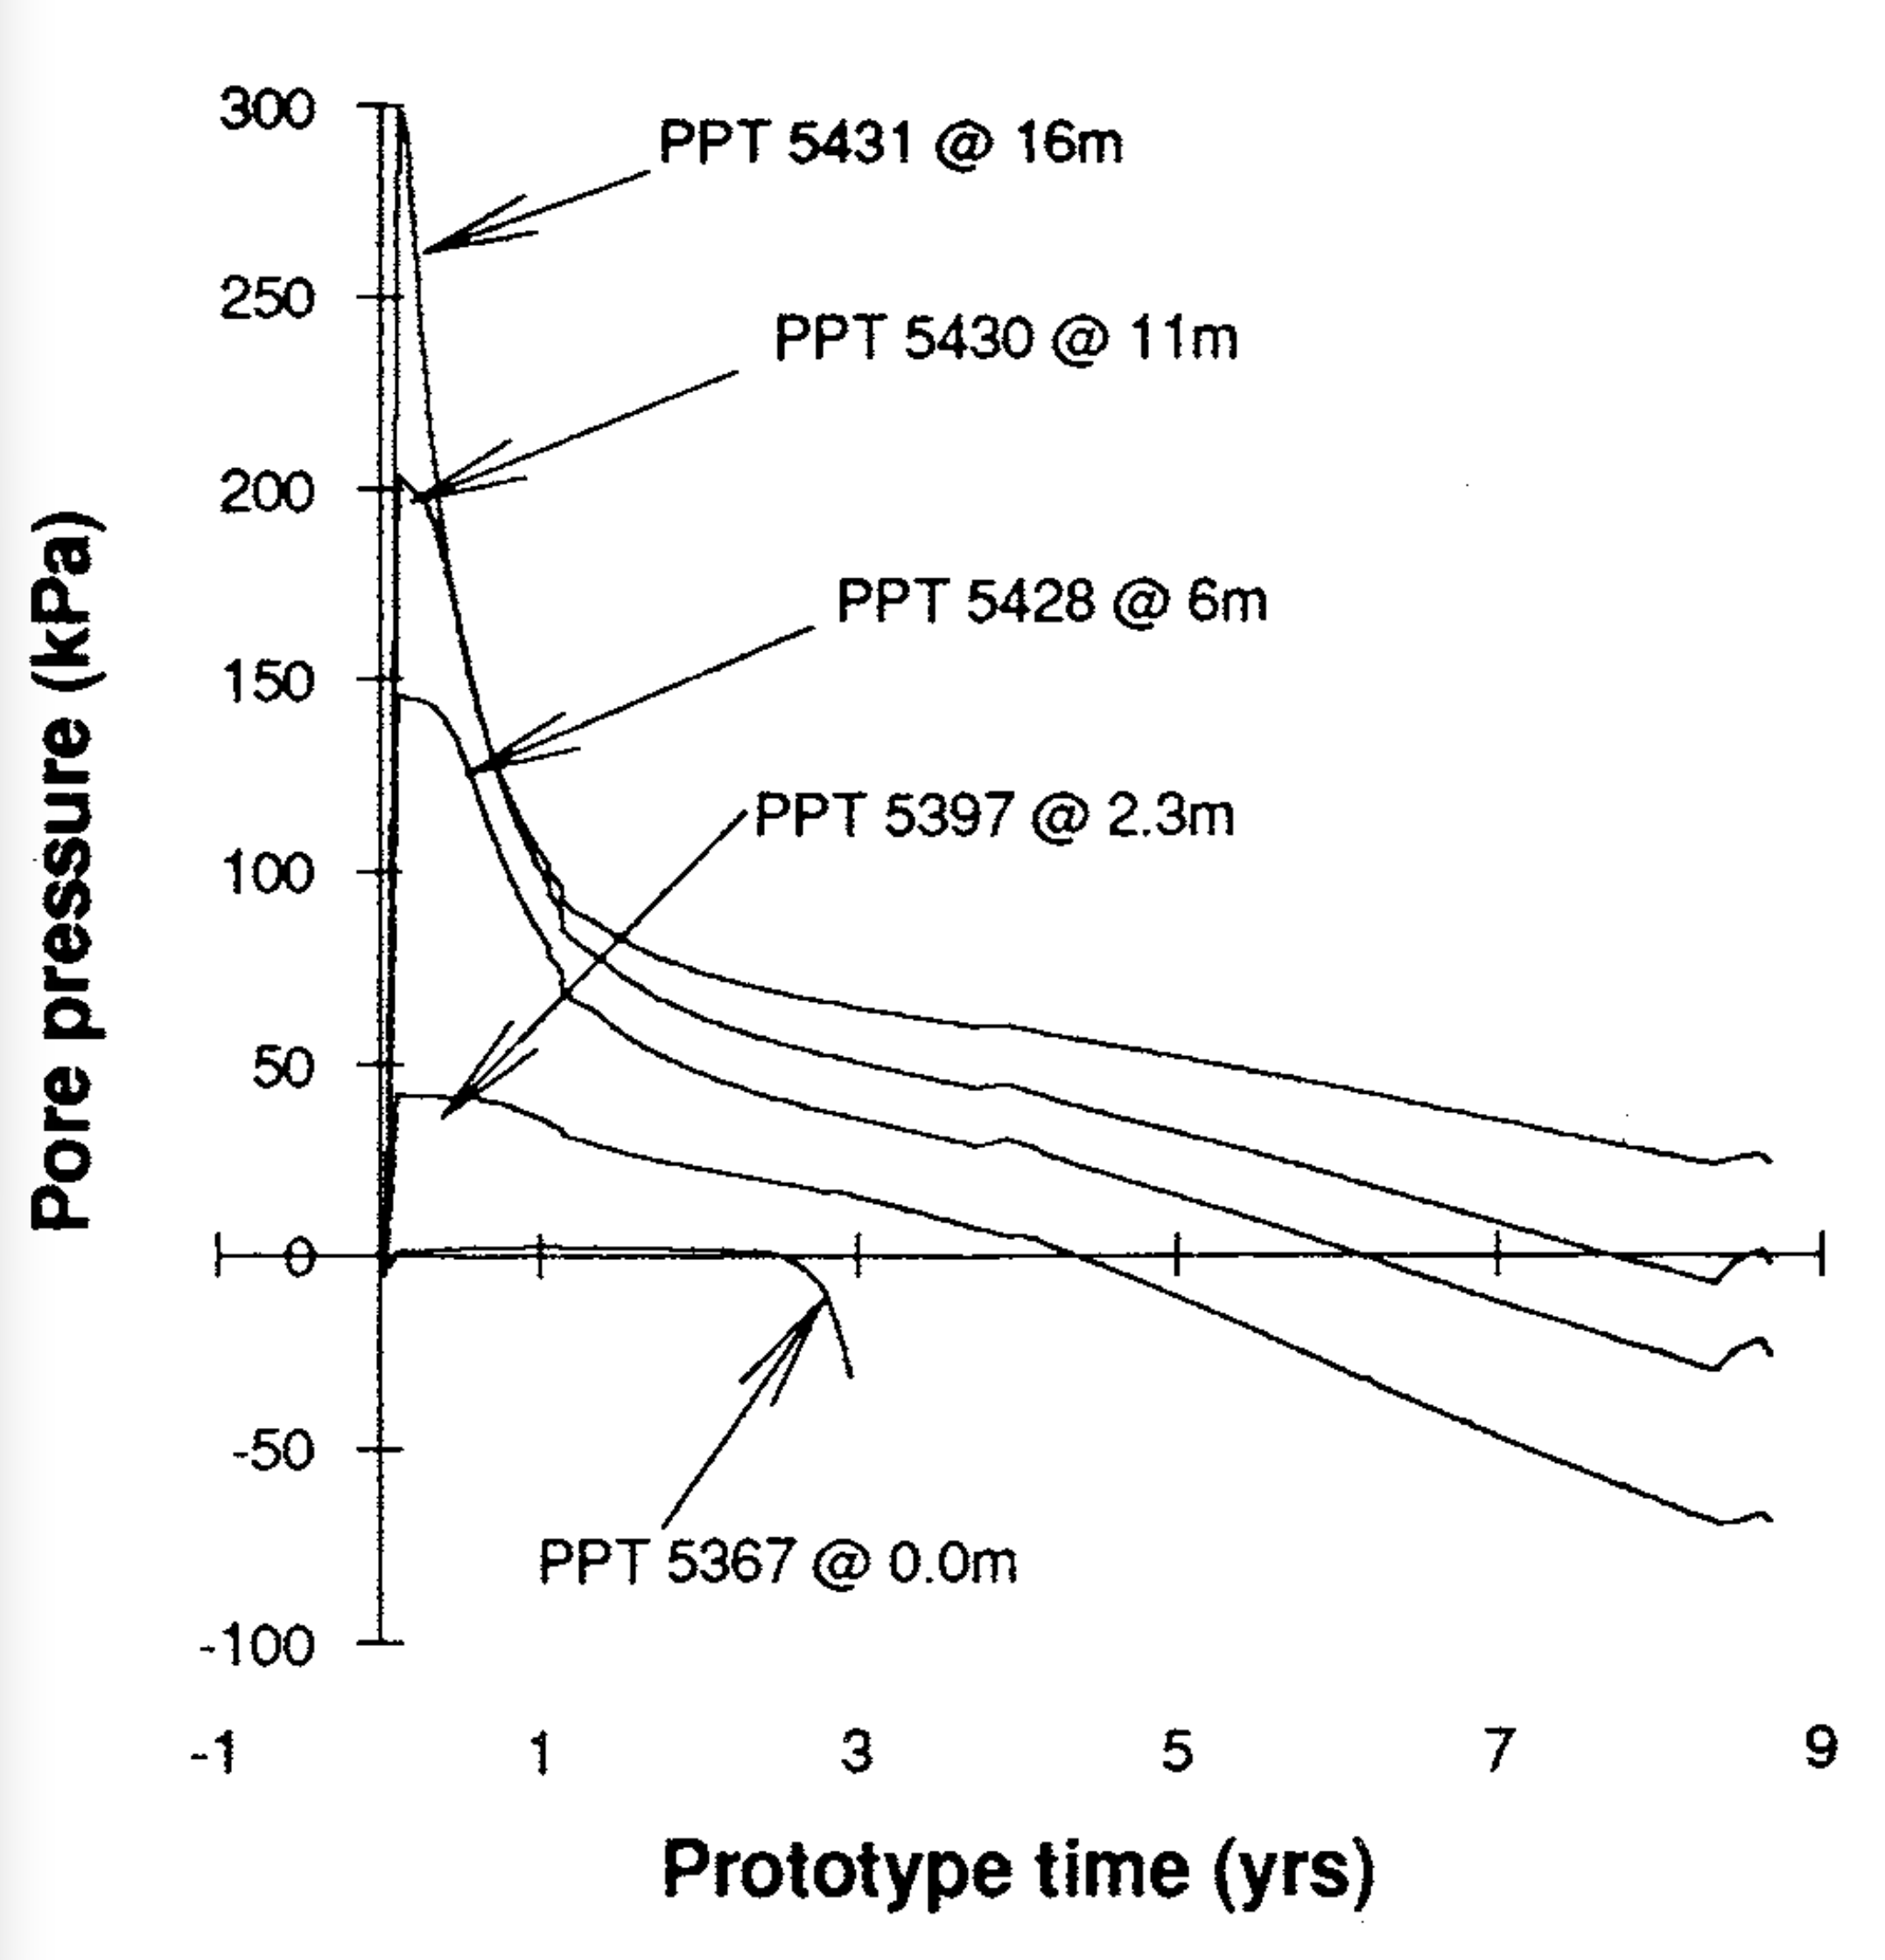
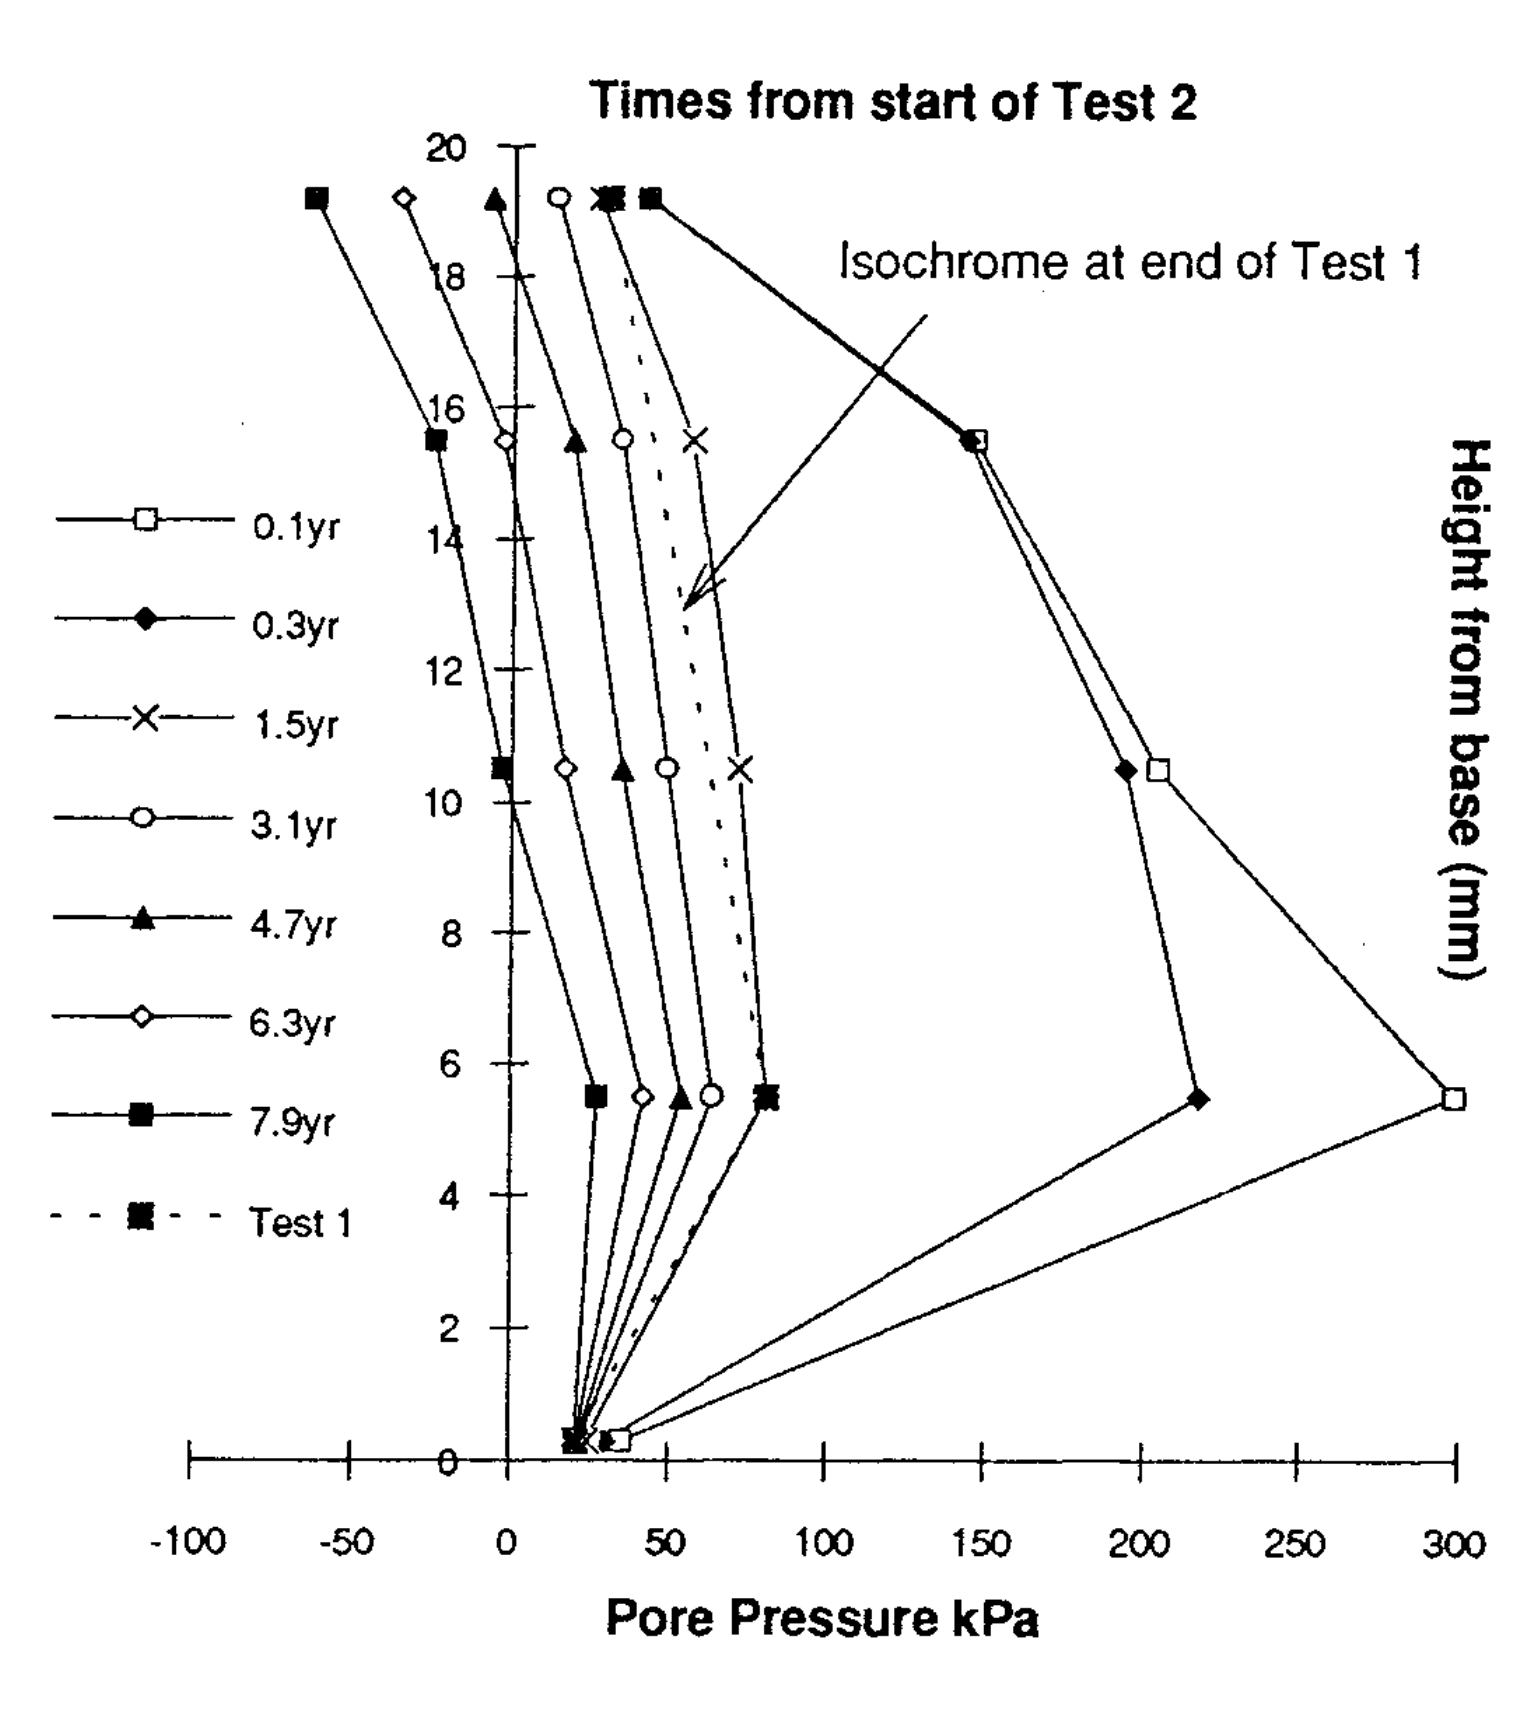
A typical overview of the pore pressure transducer data from Test 1, in this case for the placement and consolidation of layer 9, is shown in Figure 7. An overview of selected pore pressure responses for Test 2 is shown in Figure 8. These pore pressure data can be used to plot isochrones of total pore pressure at various stages in the centrifuge tests. By comparing the final isochrone present at the termination of Test 1 with the development of isochrones in Test 2 it is possible to deduce the re-consolidation time required to establish the effective stress condition in Test 2 corresponding to that present at the end of Test 1. Figure 9 shows the pore pressure isochrones at various stages of consolidation for both tests. It is apparent from this plot that after about 1 to 1.5 years the pore pressure isochrone generated in Test 2 is virtually coincident with that obtained at the end of Test 1. Furthermore the response of the surface transducer indicated that the depth of surface water increased for the first year of Test 2 but then started to drop. This can be interpreted as a switch from two-way drainage (associated with re-consolidation) to predominantly one-way drainage. Consequently, it has been assumed that a re-consolidation time of 1 year was required for conditions in Test 2 to be equivalent to those at the end of Test 1.
The overview of the pore pressure responses recorded for the duration of Test 2, as shown in Figure 8, indicate that the water table starts to drop below the residue surface after approximately 2.5 years. At the termination of the test the water table is some 11 m below the residue surface. However, this observation is difficult to relate to a field situation since the rate and degree of water table drop would be determined by the evaporation and recharge rates – i.e. a mass balance relationship. Theoretically, it is possible that the water table could drop to the base of the residue provided that the net recharge rate did not exceed the rate at which fluid could drain (under gravity) through the residue.
4.4 Underdrainage and surface run-off
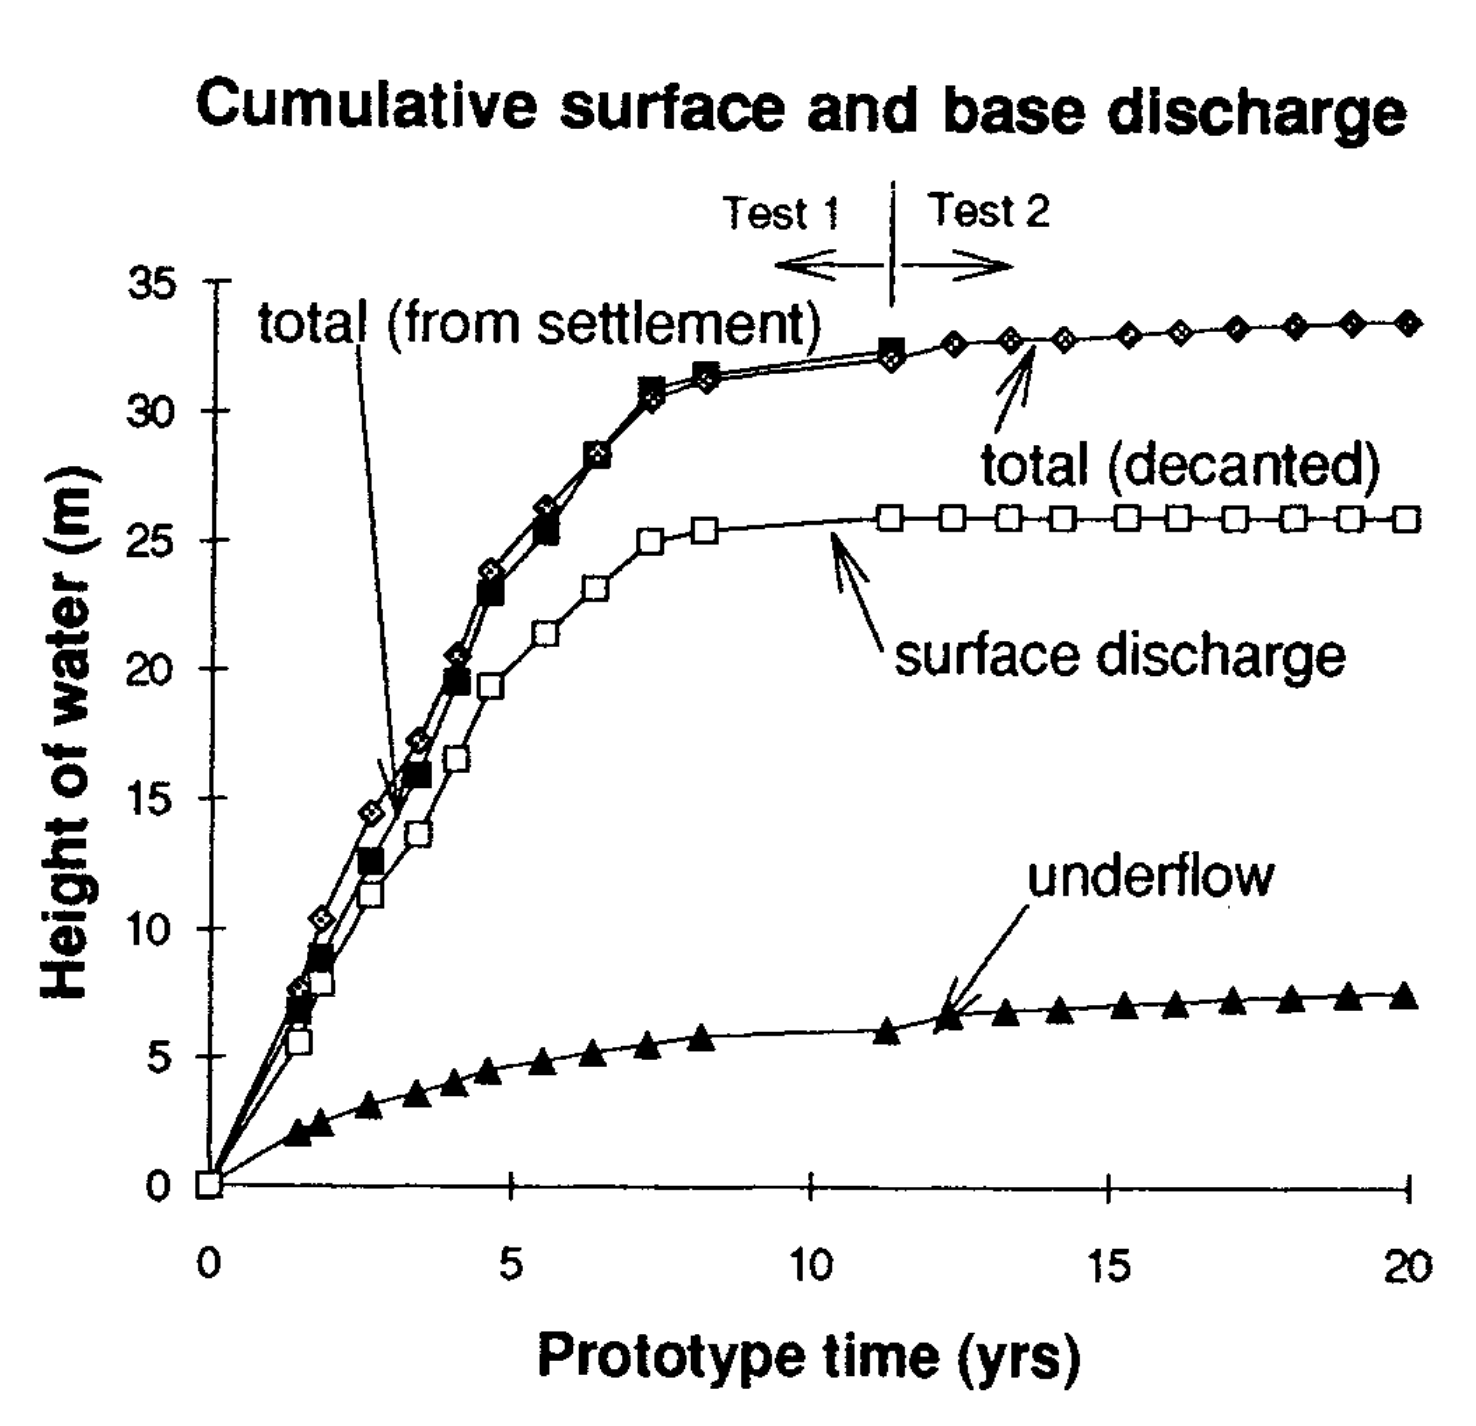
Surface and base run-offwere measured by collecting the underdrainage and decanting the surface water at the end of each centrifuge run. These measured quantities can then be compared with estimates of total run-off calculated from the total incremental settlement of the model during each centrifuge run. The data are represented in terms of equivalent fluid heights (in metres) and are presented in Figure 10.
The consolidation data presented earlier indicate that little or no fluid flows to the residue surface some 5 years after filling. After initial high underdrainage in the first 2 years a small amount of flow will continue indefinitely if the residue surface is recharged, or until the water table finally falls to the base of the impoundment.
4.5 Solids Content
Average solids content obtained from both R4 and the centrifuge test are shown on Figure 6. Measured solids contents for discrete layers from R4 are shown in Figure 3 and measured solids contents from the centrifuge test are shown in Figure 4.
The average densities obtained from the centrifuge tests are generally lower than that actually measured in R4 up until the end of 1991. For example, the average solids content in R4 at April 1991 were 63.6% compared with 62.5% to 63% from the centrifuge test. After the end of 1991, solids contents estimated in R4 were less than those obtained in the centrifuge, with the estimated maximum solids content tending towards 71 % over 20 years.
4.6 Strength
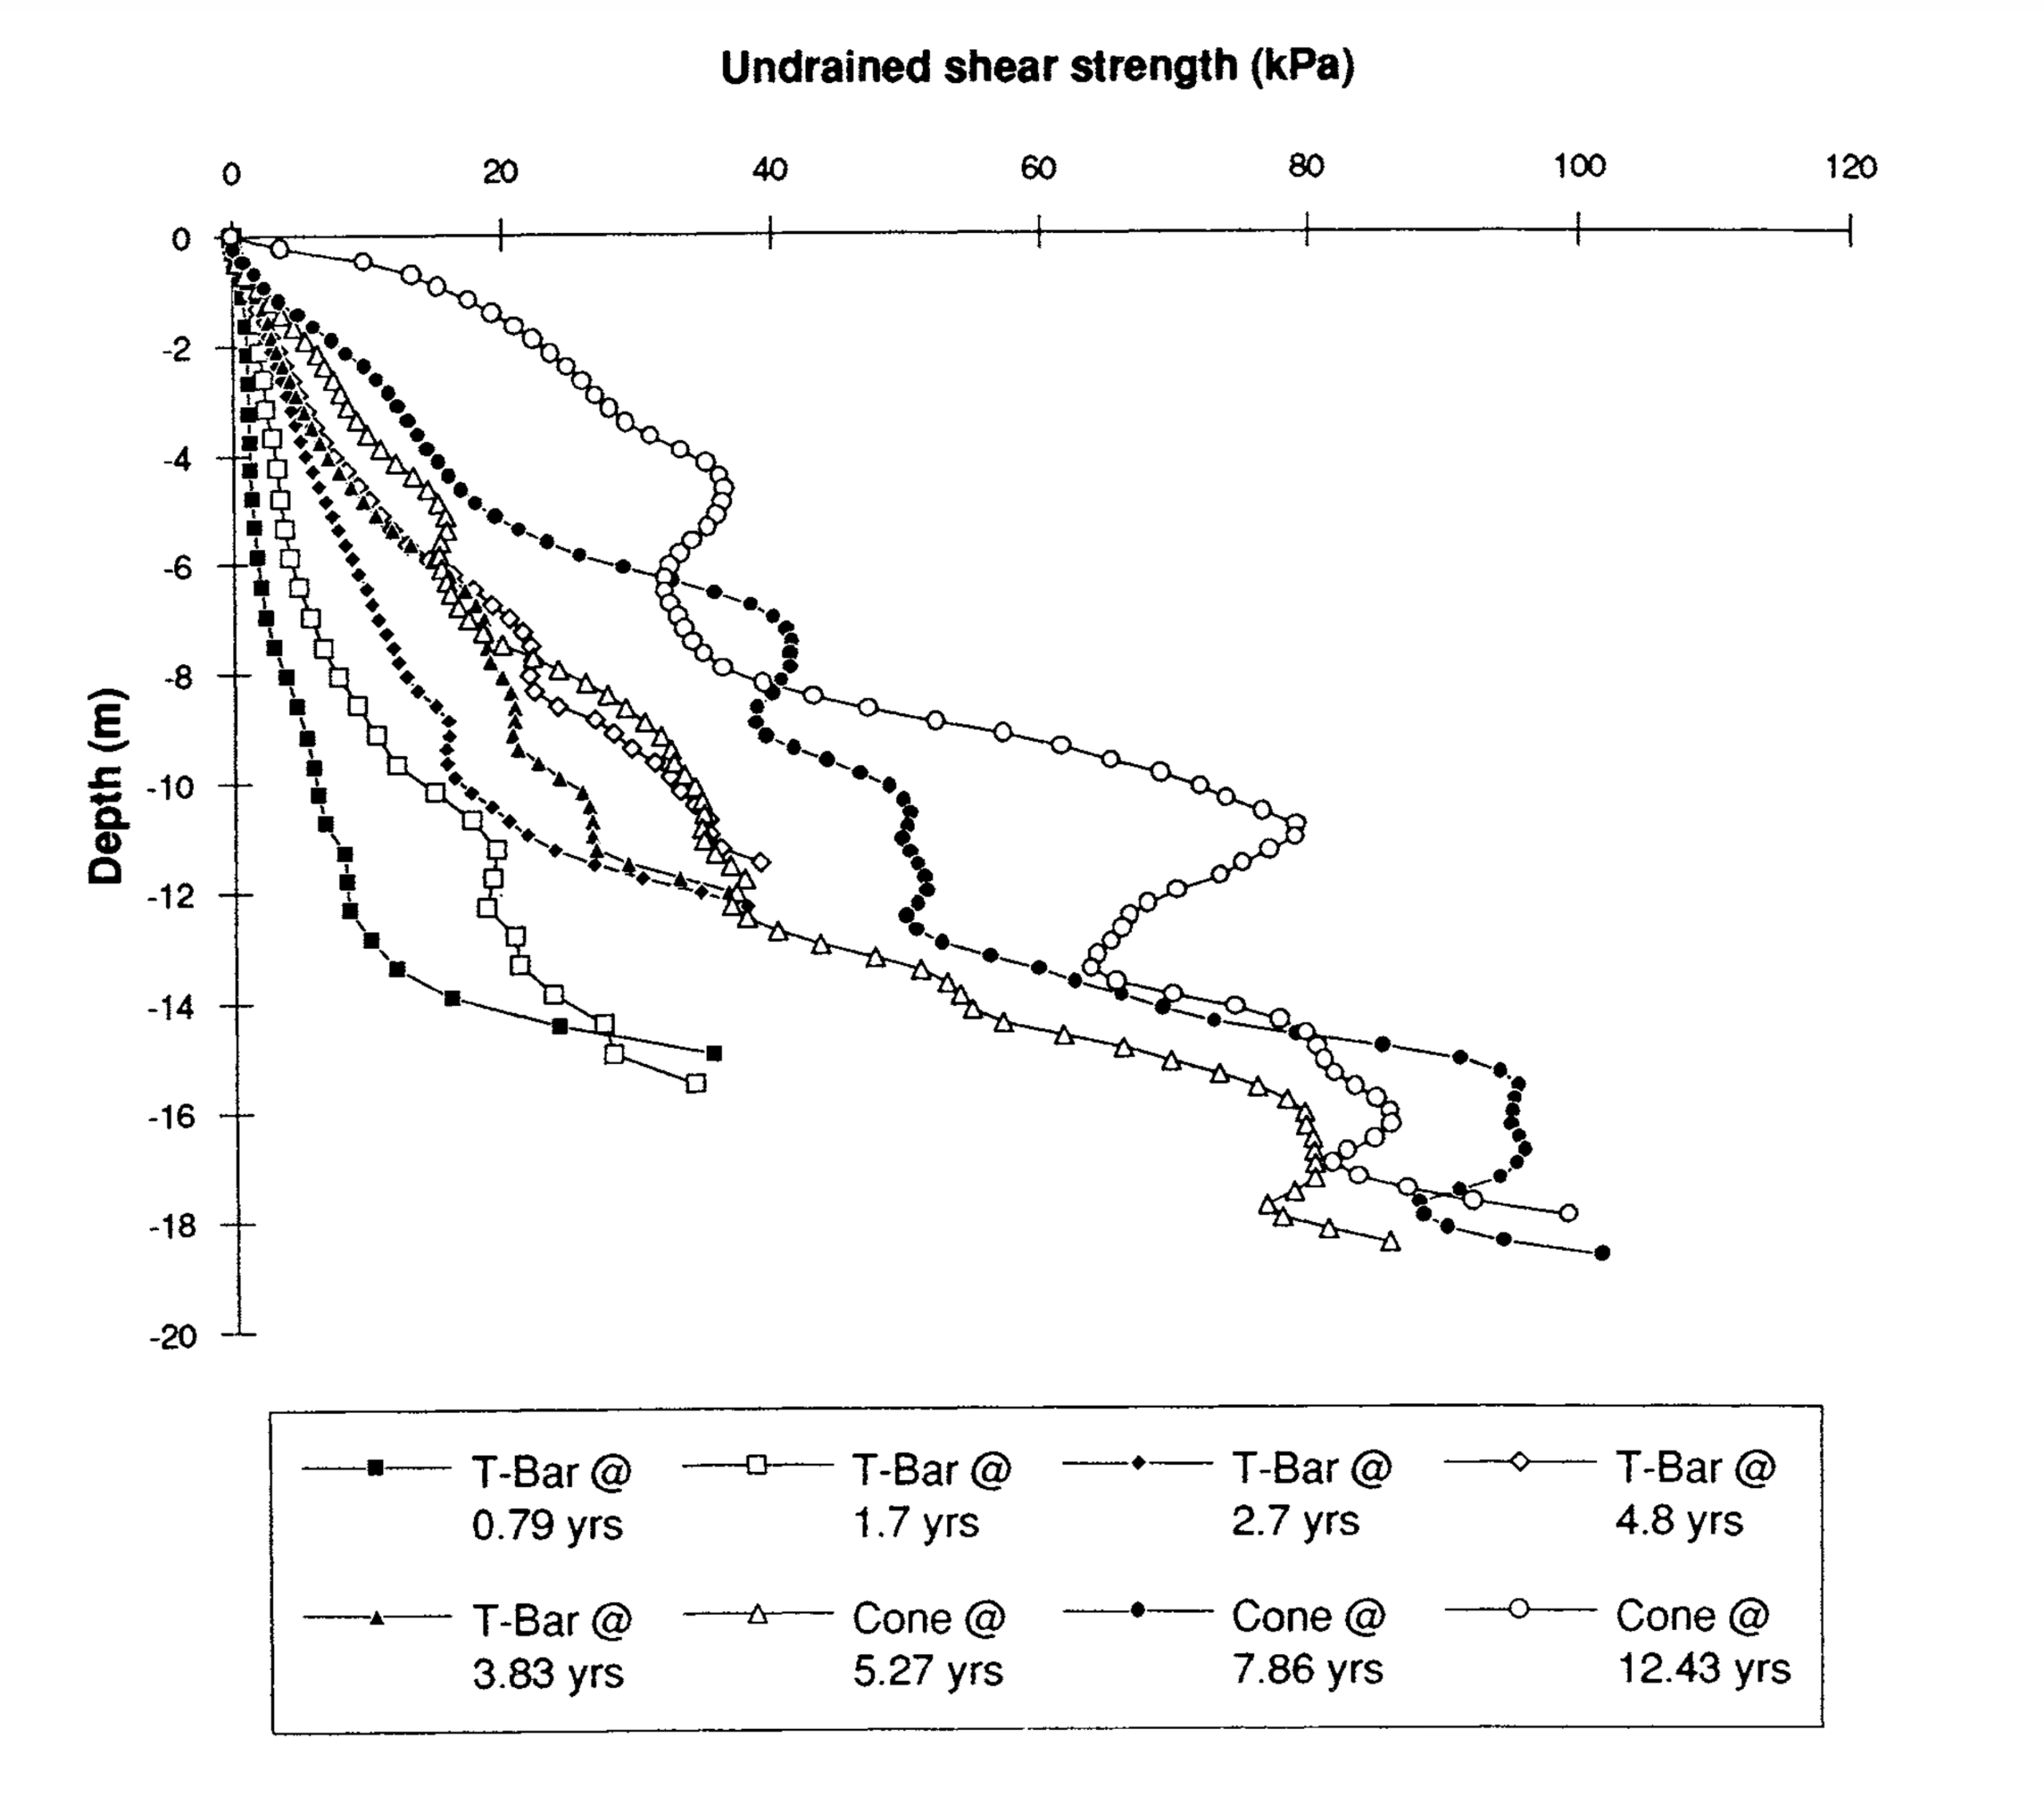
Measurement of the relatively low strengths expected during the model construction and subsequent short term consolidation phase, was obtained using a ‘T’-Bar penetrometer device. This device utilises the plasticity solution for a circular bar penetrating a deposit of cohesive soil. Details of the apparatus can be found in Stewart and Randolph (1991). Cone penetrometer tests were used for the higher strengths. Strength profiles are shown in Figure 11.
It should be noted that there is relatively little increase in shear strength for the top 8 m or so from 4 to 8 years after filling to 27 m (ie from T-Bar test 9 (at 4.8 yrs) to cone test 2 (at 7.8 yrs). There is a significant increase in shear strength in the upper regions of the residue deposit some 12 years after filling to 27 m. The strength profiles obtained from the cone penetrometer tests indicate fluctuations in the residue strength_ This is thought to be the result of the coarser fraction of each layer settling to produce stiffer zones of material at the base of each added layer of residue. The increase in strength between cone test 2 (7.86 yrs) and 3 (12.43 yrs) is attributed to the drop in water table to some 11 m below the residue surface, leading to negative pore pressures and higher effective stresses in the upper region of the residue deposit.
5. Deprivation of Consolidation Parameters
The centrifuge model tests performed in this study were designed to replicate the construction and behaviour of a prototype residue impoundment, and cannot easily be used to determine traditional consolidation parameters of the residue. However, it is possible to consider Test 1 as being analogous to a one-dimensional consolidation test. From each incremental placement of residue a net increment of applied stress can be deduced. By considering an initial residue depth, and using averaged solids content (as given in Figure 6), which are associated with an assumed degree of consolidation, then void ratio versus effective stress relationships can be derived for the chosen initial residue depth. Figure l(a) shows two such relationships corresponding to assumed degrees of consolidation of 70 and 90% for subsequent additions of residue after consolidation of layer 3. An approximate value for the compression index () of 0.75 can be derived from the relationships. This value is about twice the value deduced from the Rowe cell test data (Figure 2), which gives a value of about 0.35 over a similar stress range.
It is also possible to make some tentative estimates of the coefficient of consolidation from the pore pressure data presented in Figure 8.
For the final layer placement to 27 m the pore pressure responses in Figure 8 indicate that about 50% consolidation has occurred after about 2 years, and that about 90% consolidation occurs in about 4 years. The corresponding and values of are thus estimated as 15 and 33 m²/year respectively.
These values are in reasonable agreement with those derived from the Rowe cell tests over a similar stress range, see Figure 1(c).
6. Conclusions
Centrifuge testing carried out to assess consolidation of Gold Mine Residue indicate that:
- at the maximum depth of residue (27 m), after completion of residue placement, 2.8 m settlement will occur after 1 year, 3.5 m after 2 years and 5.4 m after 12 years. Primary consolidation is complete some 4 years after filling with an associated settlement of approximately 4 m.
- the amount of underdrainage decreases significantly after initial consolidation of the lower layers of residue, resulting in a blanket of low permeability.
- surface discharge decreases significantly within 2 years of final placement and is expected to stop some 5 years after final placement.
- the average maximum solids content of the residue is estimated at 71% some 12 years after final placement.
- the strength of the residue is consistent with a normally consolidated clay; significant strength gain occurs only with lowering of the water table which occurs approximately 5 years after filling.
- the centrifuge model causes consolidation that is analogous to a one dimensional consolidation test but with soil under a range of effective stresses and moisture contents; estimated values of compression index () and coefficient of consolidation () are:
Centrifuge Test Rowe Cell Consolidation 0.75 0.35 – 0.44 20 15 – 20 The value of is dependent on the degree of consolidation and as the residue is at varying degrees of consolidation, the value obtained is an average approximation.
7. Acknowledgements
The Authors would like to thank Worsley Alumina Pty Ltd and Gutteridge Haskins and Davey Pty Ltd for permission to publish this paper.
8. References
Croce P., PaneV., Znidarcic D., Ko H-Y., Olsen H.W. and Schiffman R.L. (1984) “Evaluation of consolidation theories by centrifuge modelling. Proc. Symp. Applications of Centrifuge Modelling in Geotechnical Design, Balkema, Rotterdam, 381-402.
Fahey, M. and Toh, S. (1992) “A methodology for predicting the consolidation behaviour of mine tailings.” Proc. Western Australian Conf. on Mining Geomechanics, Kalgoorlie, Australia.
Randolph, M.F., Jewell R.J., Stone, K.J.L. and Brown, T.A. (1991) “Establishing a new centrifuge facility.” Centrifuge ’91, Ko(ed), Balkema, Rotterdam.
Stewart, D. and Randolph, M.F. (1991) “A new site investigation tool for the centrifuge”, Centrifuge ’91, Ko(ed.) 1991, Balkema, Rotterdam.
Stone, K.J.L., Randolph, M.F., Toh, S. and Sales, A.A. (1993) “Evaluation of the consolidation behaviour of mine tailings.” Submitted to ASCE Jour. Geotech. Engng.